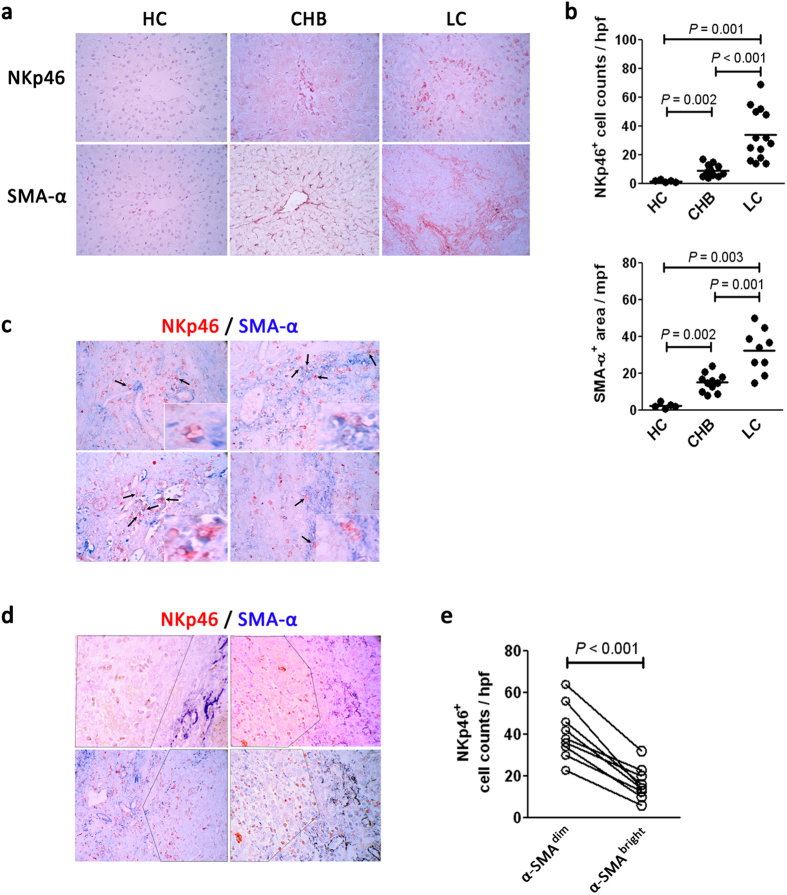
Figure 5. The spatial interaction between hepatic NK cells and HSCs in vivo in LC patients.
(a) Representative IHC staining of NKp46 and α-SMA in the livers of HC, CHB and LC subjects. (b) The quantitative analysis of NKp46+ cells and SMA-α+ cells in the livers of enrolled subjects. Each dot represents one individual. The horizontal lines indicate the mean values. P-values shown in the figures are based on two-tailed, unpaired Student’s t-test; hpf, high-power field. (c) Representative double staining of NKp46 (red) and α-SMA (blue) indicating the close proximity of NK cells to HSCs in mild fibrotic areas in the livers of four HBV-infected LC patients. The inset figure was magnified to indicate the close interaction of NK cells and HSCs in the livers of LC patients. (d) Representative double staining of NKp46 (red) and α-SMA (blue) indicating their separate distribution in severe cirrhotic regions in four HBV-infected advanced LC patients. The dashed line separates the picture into α-SMAbright and α-SMAdim areas. (e) The quantitative analysis of NKp46+ cells in α-SMAbright and α-SMAdim areas in the livers of LC patients. Each dot represents one individual. P-values shown in the figures are based on two-tailed, unpaired Student’s t-test.

