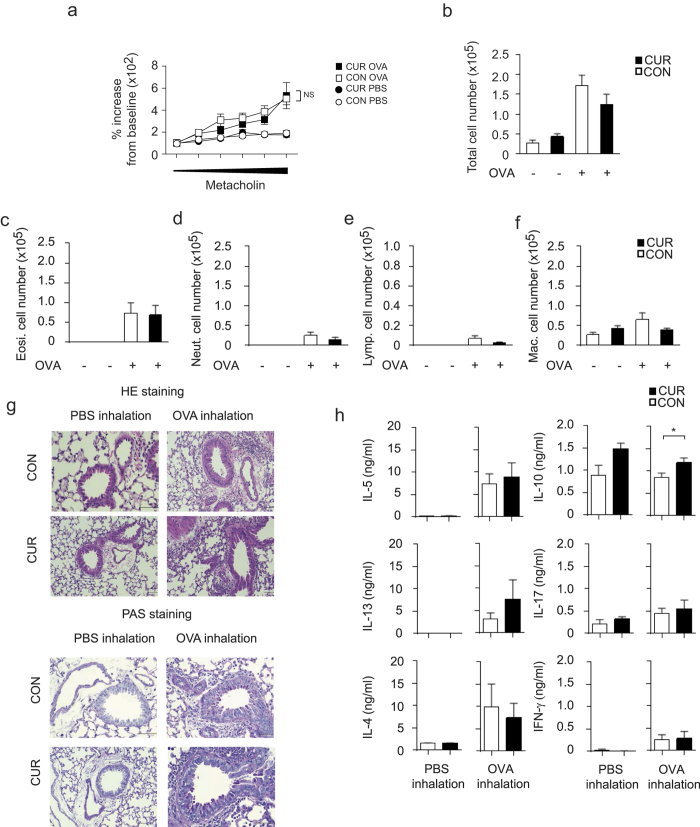
Figure 2. Oral administration of CUR showed little effects on OVA-induced allergic airway inflammation.
(a) AHR was assessed as lung resistance. Mean values (5 to 6 mice per group) are shown with SEM (square symbols represent OVA challenge, circles represent PBS challenge) (b–f) The cell number of total mononuclear cells (b), eosinophils (c), neutrophils (d), lymphocytes (e), and macrophages (f) in the BAL fluid are shown. Mean values with SEM (5 to 6 mice per group) are shown. (g) Antigen-induced leukocyte infiltration into the lungs was evaluated by H&E staining (upper panel). Mucus production induced by OVA was examined by histological analysis (PAS staining) (lower panel). (h) The concentration of the indicated cytokines in the BAL fluid were measured by cytometric bead array. Mean values with SEM (5 to 6 mice per group) are shown. (a–f), no significant differences were found between CUR/OVA and CON/OVA; h, *P < 0.05, Mann-Whitney test).

