
Figure 7. Overexpression of CA STAT3 selectively inhibits Il12b and Il23a but not Il12a expression.
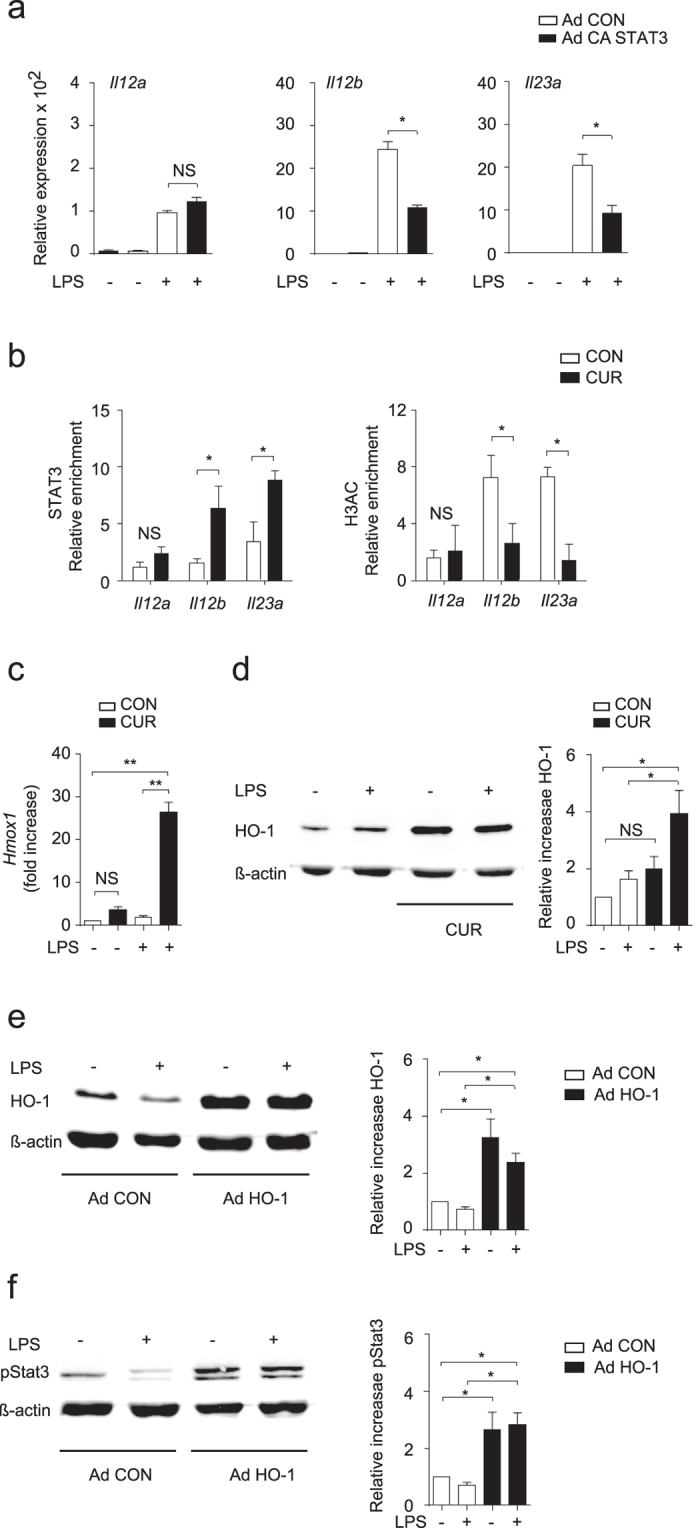
(a) DCs were infected with control adenovirus (Ad CON) or CA STAT3 (Ad CA STAT3) containing adenovirus and stimulated with LPS for 1 hour. Il12a, Il12b and Il23a mRNA expression was analyzed by quantitative RT-PCR. Data were normalized to ß-actin and expression before LPS activation was set as 1.0. The results show mean ± SEM of 3 independent experiments (*P < 0.01; One Way ANOVA, Tukey’s post-hoc test). (b) ChIP analysis of DC treated with DMSO (CON) or CUR and stimulated with LPS, followed by crosslinking and immunoprecipitation with antibody to STAT3 (left panel) or acetylated histone H3 (H3Ac, right panel). Bound DNA was amplified by quantitative PCR for primer sites in Il12a, Il12b and Il23a promoter regions. Bars represent mean ± SEM of 3 independent experiments (*P < 0.05; One Way ANOVA, Tukey’s post-hoc test). (c) HO-1 is induced by CUR in DC in vitro. DC were treated with DMSO (CON) or CUR in DMSO (CUR) before activation with LPS for 1. Expression of Hmox1 mRNA was determined by quantitative RT-PCR (c) and HO-1 protein was analyzed by Western blotting (d). The results in (c,d) show mean ± SEM of three independent experiments (*P < 0.05, **P < 0.01; One Way ANOVA, Tukey’s post-hoc test), the blot shown in (d) is representative for three independent experiments with similar results. Actin expression served as control. (e,f) Overexpression of HO-1 increased STAT3 phosphorylation in DC. DCs were infected with control adenovirus (Ad CON) or HO-1 containing Ad HO-1 and stimulated with LPS for 1 h. Overexpression of HO-1 protein was analysed by Western blotting (e). The expression of phosphorylated STAT3 (pSTAT3) in DC treated as in (e) was analysed by Western blotting (f). One representative immunoblot and pooled data from 4 independent experiments are shown (mean ± SEM *P < 0.05; One Way ANOVA, Tukey’s post-hoc test). The Western blot samples for HO-1/β-actin or pSTAT3/β-actin were run on the same gels and the blot images were cropped based on the molecular weight (32 kDa for HO-1, 79/86 kDa for pSTAT3 and 43 kDa for β-actin). The complete Western blot figures (d–f) can be found as Supplementary Figs S11 to S13.