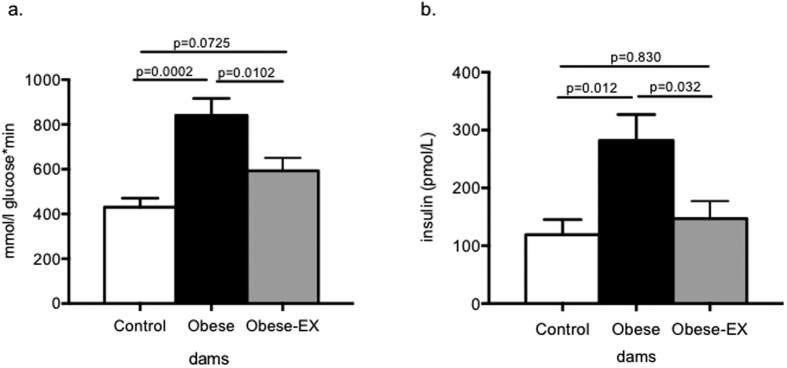
Figure 2. Glucose tolerance test at D18 of pregnancy and fed insulin concentrations at D19.
On day 18 of gestation, control (white bars), obese (black bars) and obese-exercised (grey bars) dams were fasted for 4 hours, weighed and given an intraperitoneal dose of glucose (1 g/kg). Tail blood glucose was measured at time 0 (before the injection) and then again at timed intervals from the time of injection. Tail blood glucose measurements during the GTT were analyzed and presented as (a) area under the curve measurements calculated by summation of trapezoids and (b) fed serum insulin concentrations at E19 as measured by ELISA. Data are presented as means+/−SEM, n = 6 per group. The effects of obesity and exercise were analyzed by One-way ANOVA followed by Tukey’s multiple comparison test.

