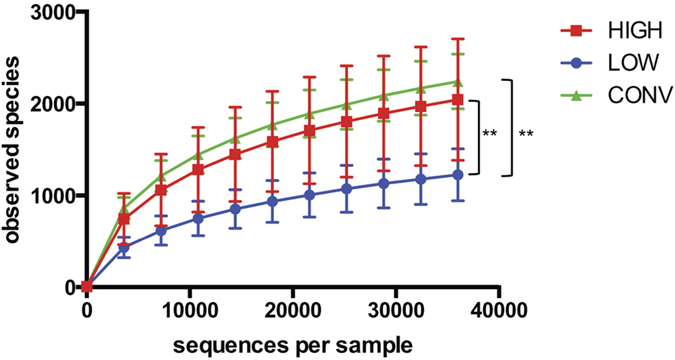
Figure 5. Diversity indexes.

Rarefaction curves based on observed species index (97% sequence similarity threshold), Chao1 and Shannons diversity index. Alpha diversity measure expressed with observed species and chao1 indexes revealed significantly reduced (p < 0.01) diversity in ex-germ-free mice inoculated with the gut microbiota from the lowest responding CONV mouse (LOW) compared to ex-germ-free mice inoculated with the gut microbiota from the highest responding CONV mouse (HIGH) as well as to barrier protected mice (CONV). Shannon diversity index only revealed a reduced (p < 0.01) diversity in LOW mice compared to CONV mice. **p < 0.01.
