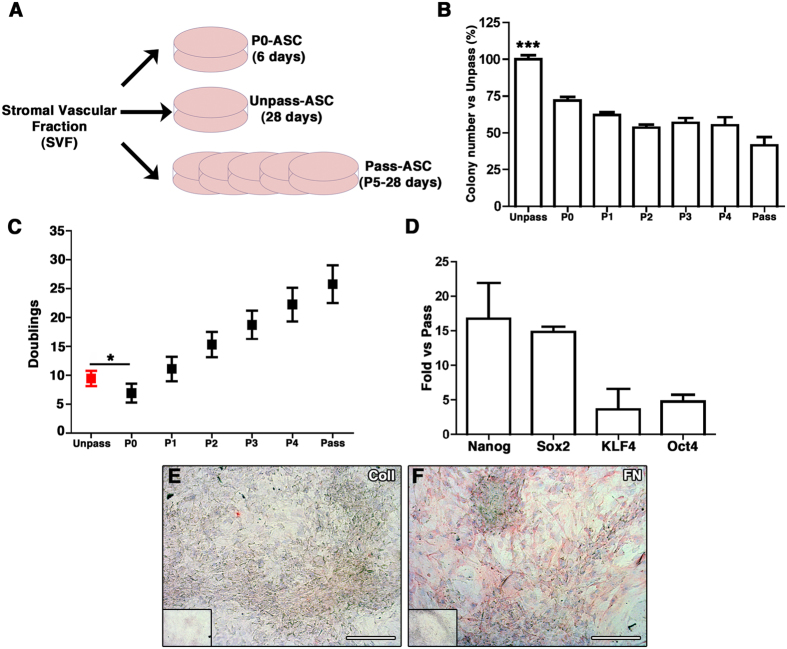
Figure 1.
(A) Schematic representation of the protocol used to generate P0, Unpass- and Pass-ASC from SVF cells; (B) Number of colonies (expressed as percentage of colonies in the Unpass-ASC condition) in Unpass-ASC and from P0 (P0-ASC) to P5 (Pass-ASC) (***p < 0.001 for Unpass-ASC vs all other groups, ANOVA with Bonferroni multiple comparisons test); (C) Number of population doublings performed by Unpass- and Pass-ASC from P0 to P5 (*p < 0.05, ANOVA with Bonferroni multiple comparisons test); (D) Quantification of mRNA expression for Nanog, Sox2, KLF4 and Oct4 in Unpass-ASC expressed as fold vs. Pass-ASC. (E,F) Immunohistochemical analysis for Collagen type I (E) and fibronectin (F) of Unpass-ASC-produced ECM; Size bar = 100 μm.

