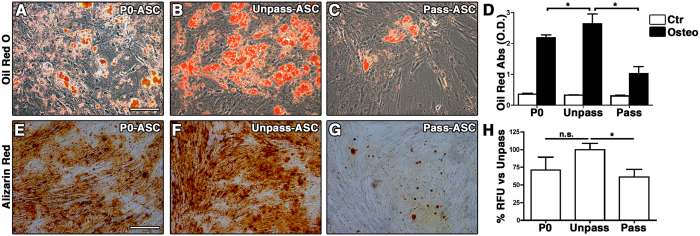
Figure 2.
(A–C) Representative microscopic fields of Oil Red O staining of P0, Unpass- and Pass-ASC (Size bar = 100 μm); (D) Quantification of Oil Red O staining of P0, Unpass- and Pass-ASC cultured in control (white bar) or adipogenic medium (black bar); (E–G) Representative microscopic fields of alizarin Red staining of P0, Unpass- and Pass-ASC. Size bar = 100 μm; (H) Quantification of hydroxyapatite deposits in the P0, Unpass- and Pass-ASC conditions (results are expressed as percentage of the Unpass-ASC condition). *P < 0.05, n.s. = not significantly different (ANOVA with Bonferroni multiple comparisons test).

