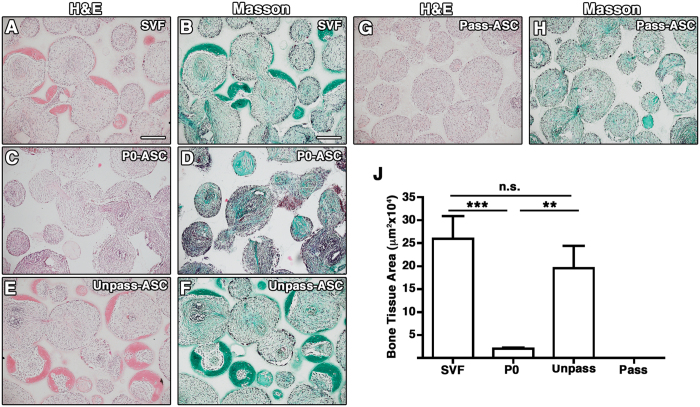
Figure 3.
Representative microscopy fields of histological sections of constructs loaded with SVF cells (A,B), P0 (C,D), Unpass- (E,F) and Pass-ASC (G,H), stained with H&E (A,C,E,G) and Masson’s trichrome staining (B,D,F,H). Size bar = 200 μm; (J) Quantification of bone tissue formation area, **p < 0.01, ***p < 0.001, n.s. = not significantly different (Kruskal-Wallis with Dunn multiple comparisons test).

