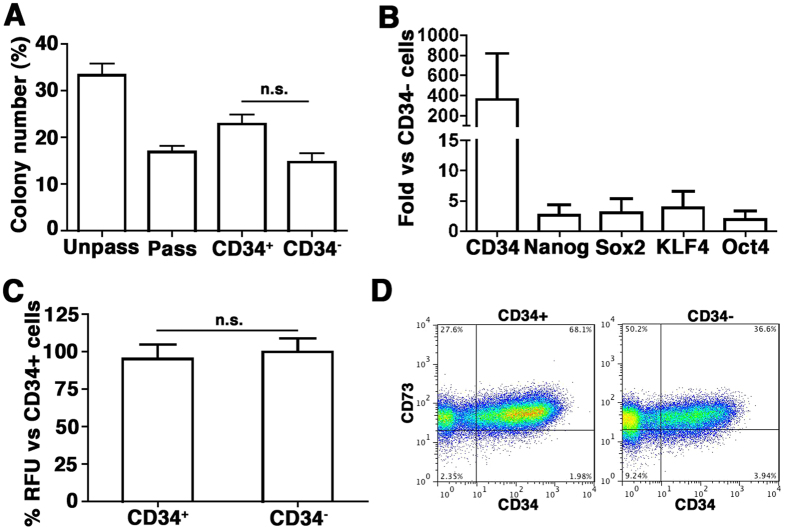
Figure 4.
(A) Number of colonies, expressed as percentage of plated cells, for Unpass-, Pass-ASC, CD34+ and CD34− sorted cells. n.s. = not significantly different (ANOVA with Bonferroni multiple comparisons test); (B) Quantification of mRNA expression for CD34, Nanog, Sox2, KLF4 and Oct4 in the CD34+ fraction of cells, expressed as fold vs CD34− cells; (C) Quantification of hydroxyapatite deposits expressed as percentage of the CD34+ condition. n.s. = not significantly different (Mann-Whitney); (D) Representative cytofluorimetry plots for CD34 and CD73 of CD34+ and CD34− sorted cells cultured as monolayer for 2 weeks after sorting.

