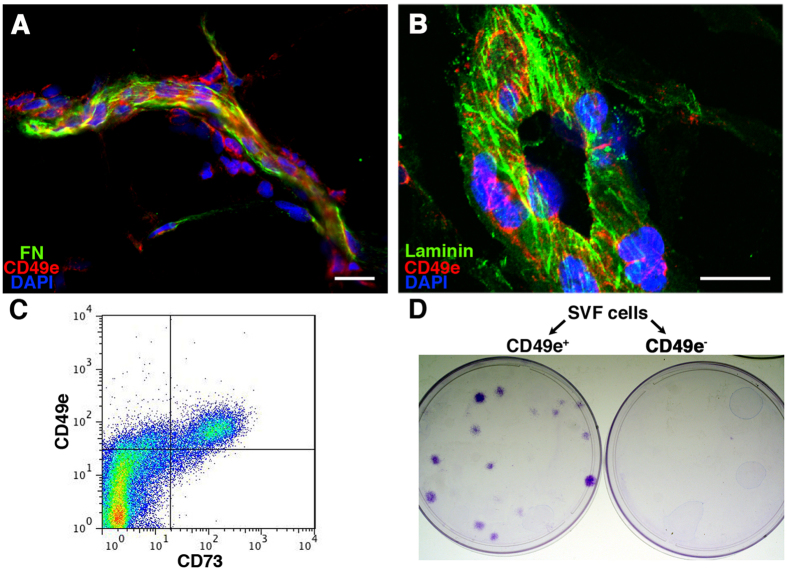
Figure 7.
(A) Immunofluorescent staining of fibronectin (in green), α5-integrin/CD49e (in red) and nuclei (in blue) on frozen sections of human adipose tissue; (B) Immunofluorescent staining of laminin (in green), CD49e (in red) and nuclei (in blue) on frozen sections of human fat tissue. Size bar = 20 μm (C) Representative cytofluorimetry plot of SVF cells stained for CD73 and CD49e; (D) Representative images of colonies generated by the CD49e+ and CD49e− sorted fractions of SVF cells.

