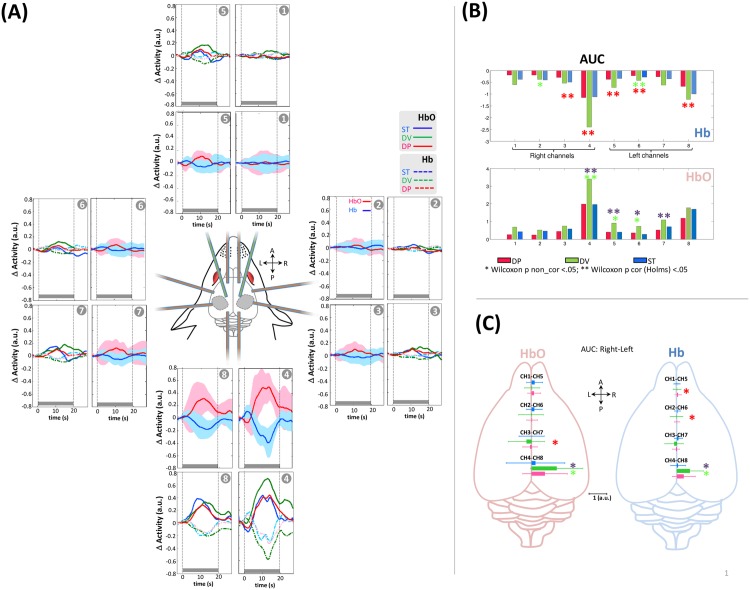
Fig 5. Auditory hemodynamic responses.
(A) Mean auditory hemodynamic response in each channel after pooling the three different conditions (deoxyHb in blue, oxyHb in red) and when they were separated (HbO). The gray rectangle indicates the duration of the stimulation block. (B, C) Area under the curve of hemodynamic response in the various channels and conditions. B) Comparisons between conditions are performed two by two in each channel.*P < 0.05, **Pcorr < 0.05. Channels 1–4 are situated over the right hemisphere (RH) and channels 5–8 are situated over the left hemisphere (LH). (* significant difference between DV vs. ST, * significant difference between DP vs. ST, * significant difference between DP vs. DV) (C) Comparison of between-hemisphere AUCs of hemodynamic responses at homotopic locations.

