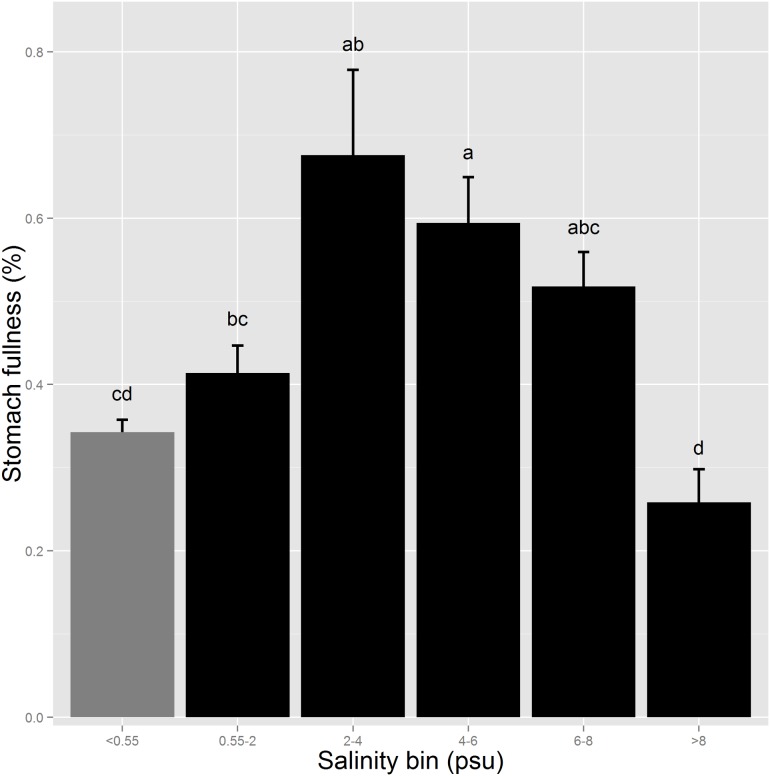
Fig 4. Mean stomach fullness (%) of Delta Smelt by salinity bin.
The grey bar represents freshwater (<0.55 psu) and the black bars represent brackish habitat (≥0.55 psu). Sample sizes for each salinity bin from lowest to highest salinity = 682, 193, 186, 112, 105, and 40. Differing letters denote statistically significant differences. Error bars are SEs.

