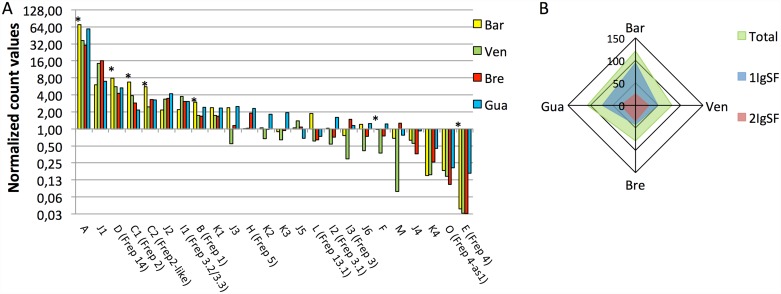
Fig 7. Abundances of transcripts for the different FREP classes in the four B. glabrata strains.
(A) The histograms represent normalized count values (upper quartile method) obtained when Bowtie 2 was used to map the BgBAR, BgVEN, BgBRE, and BgGUA reads with respect to the sequences of the 24 classes of FREP transcripts. Asterisks indicate FREP classes that contain only one IgSF domain. (B) The diagram shows the sum of normalized count values for all the FREPs (total) or the FREPs containing one or two IgSF domains.

