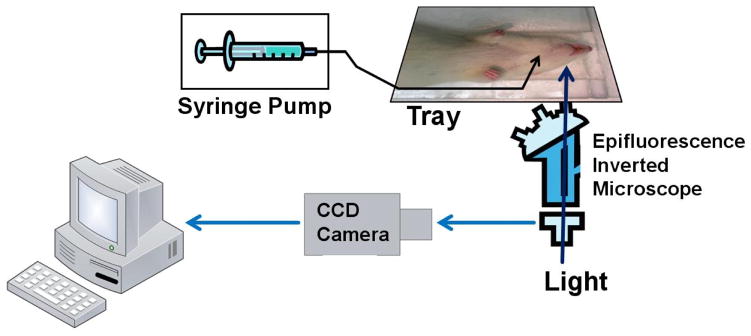
Figure 4.
Schematic for the in vivo permeability measurement of rat cerebral microvessels. The fluorescence solution was injected into the brain via a carotid artery with a syringe pump. The fluorescence images were captured by a CCD camera, which was connected to an inverted microscope. The image analysis software was then used to measure the fluorescence intensity for the region of interest in each image.

