FIGURE 5:

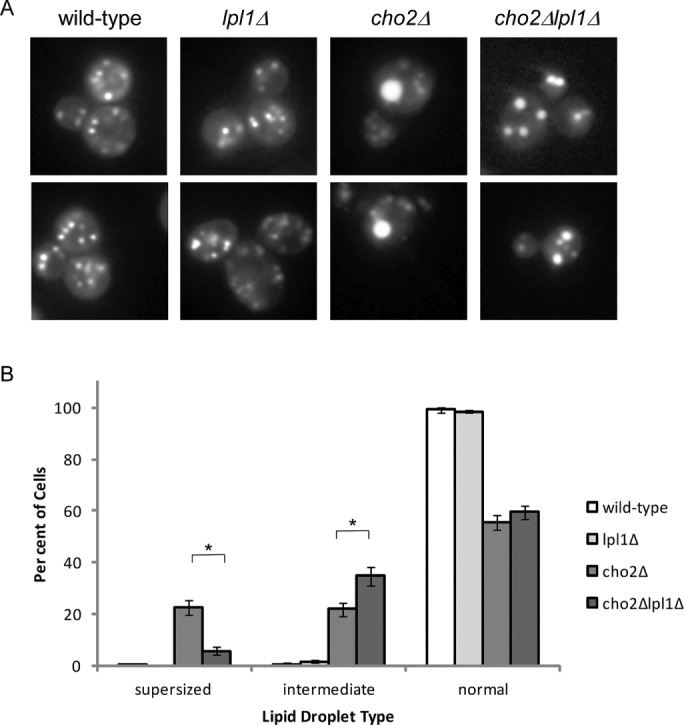
Lpl1 affects lipid droplet dynamics. (A) Representative images of lipid droplets, as visualized by fluorescence microscopy for the indicated strains. cho2Δ cells show a relative accumulation of cells with a single very large (“supersized”) lipid droplet. cho2Δlpl1Δ cells show a relative accumulation of cells with an intermediate phenotype (i.e., lipid droplets that are smaller but more numerous than those seen in cho2Δ). (B) Quantitation of normal, intermediate, and supersized lipid droplets. Six hundred cells were counted (in 100 cell groups) for each strain. Error bars represent SDs. Asterisk, statistically significant by Student's t test (p < 0.001).
