FIGURE 3:
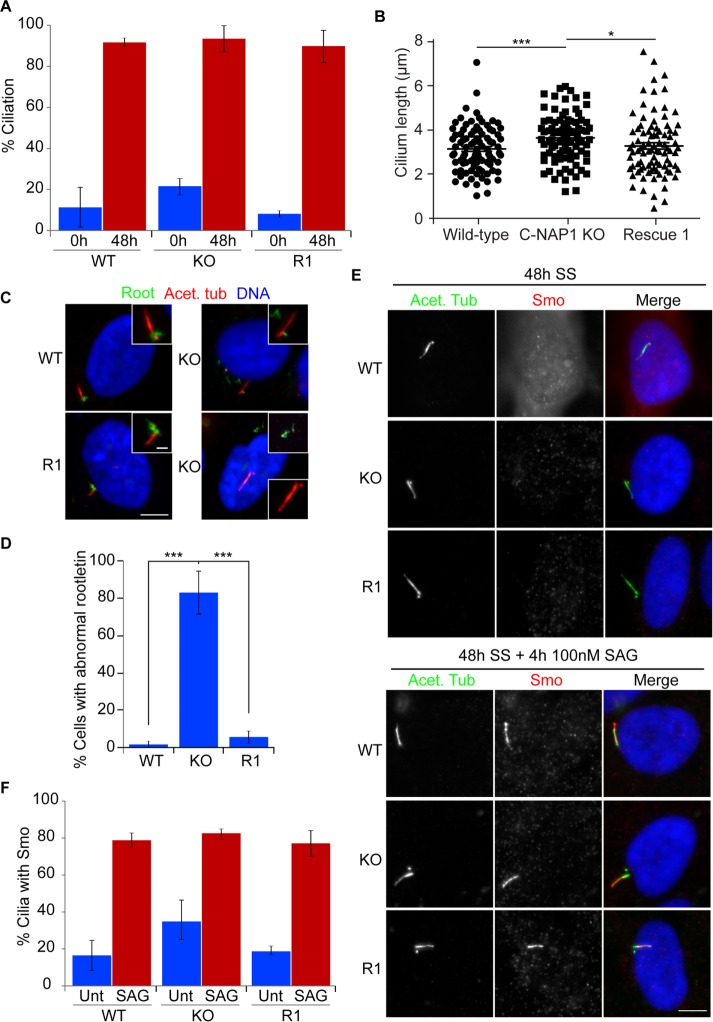
C-NAP1 nulls show normal ciliation without attached ciliary rootlets. (A) Bar chart showing ciliation frequency in wild-type, C-NAP1 knockout (KO) clone 1, and C-NAP1 rescue (R1) cells. Ciliation percentages were determined using microscopy for detyrosinated tubulin in three separate experiments in which 100 cells were counted. (B) Length of cilia in cells of the indicated genotype. Maximum intensity projections of cilia were captured and measured in Volocity using the Line tool. Thirty ciliated cells were counted in three individual experiments. (C) Immunofluorescence microscopy of the ciliary rootlet in cells of the indicated genotype. Acet. tub, acetylated tubulin; Root, rootletin. Scale bar, 5 μm (main image), 0.5 μm (inset). (D) Bar chart showing the frequency of cells that show mislocalized rootletin, that is, an aggregate not localized to the base of the cilium. One hundred ciliated cells were counted in three separate experiments. (E) Immunofluorescence microscopy of Smoothened (Smo) in the absence and presence of SAG in serum-starved (SS) cells of the indicated C-NAP1 genotype. Scale bar, 5 μm. (F) Quantitation of the frequency with which Smo was detected at cilia in the absence and presence of SAG. One hundred ciliated cells were counted in three separate experiments. ***p < 0.001; *p < 0.05 by unpaired t test.

