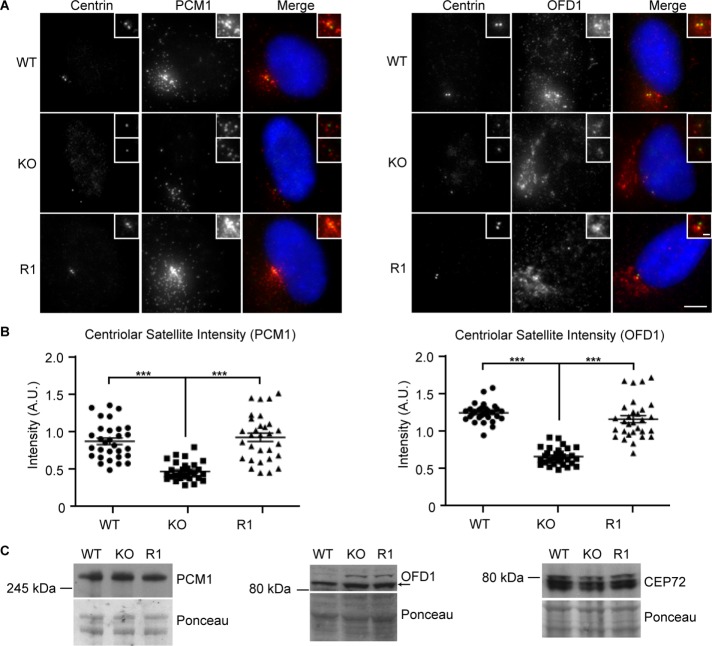
FIGURE 5:
Reduced centriolar satellite density in C-NAP–knockout cells. (A) Immunofluorescence microscopy of the indicated satellite markers in cells of the indicated C-NAP1 genotype. Scale bar, 5 μm. (B) Quantitation of the centriolar satellite density in cells of the indicated genotype. Maximum intensity projections of 10 centrosomes from G1 cells were analyzed in three separate experiments. Graphs show the sum of PCM1 or OFD1 fluorescence intensities in a 25-µm2 circle around the two centrioles in each cell in arbitrary fluorescence units (A.U.). (C) Immunoblot of centriolar satellite proteins in cells of the indicated genotype. Ponceau S staining of the membrane after protein transfer was used as a loading control. ***p < 0.001 by unpaired t test.

