
FIGURE 4:
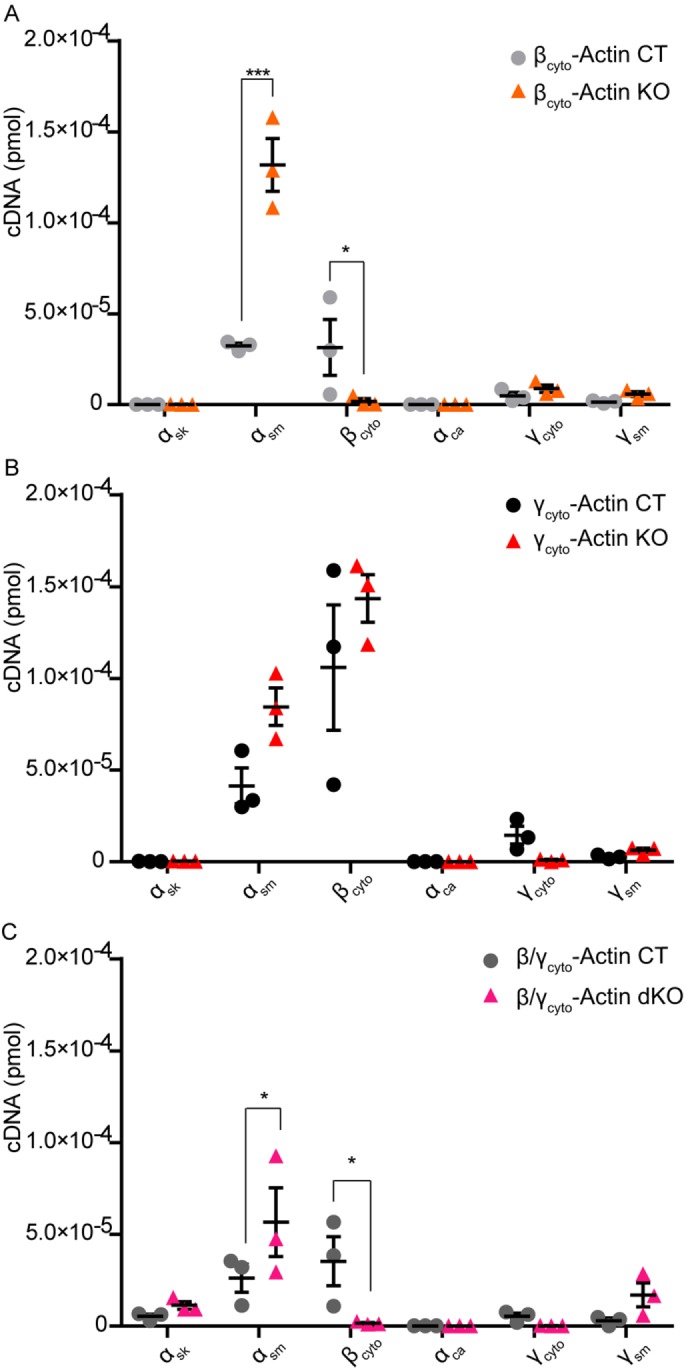
αsm-Actin transcript was up-regulated in βcyto-actin–ablated MEFs. (A–C) qRT-PCR analysis of six mouse actin isoforms in CT and KO MEFs at 5 dpi (n = 3, in triplicate). Calculated transcript amount (picomoles) were calculated based on the standard curve, amplified in parallel. *p < 0.05, ***p < 0.001. Two-way ANOVA with Bonferroni posttest; error bars are SEM.