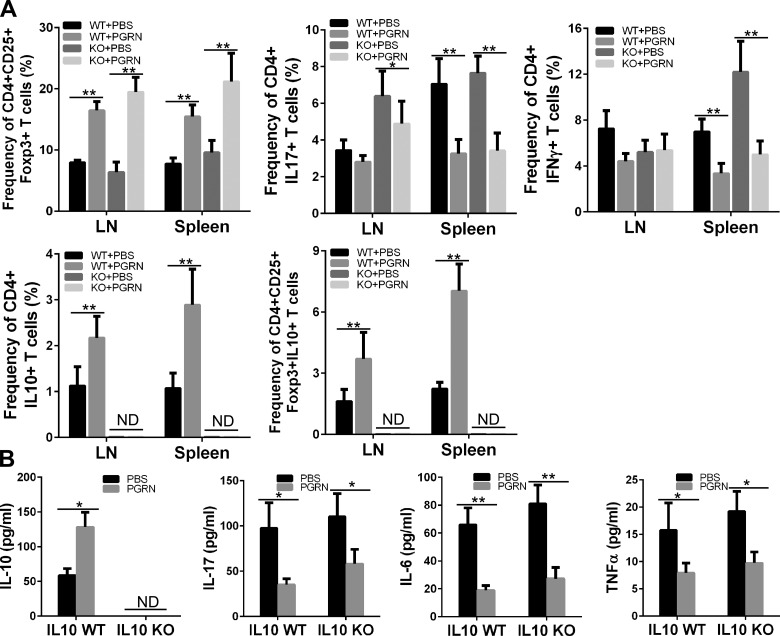
Figure 2.
PGRN increased Treg cells in CIA independent of IL-10. A) FACS analysis of Treg cells, CD4+IL17+ and CD4+IFN-γ+ T cells, and IL-10–producing CD4+ T cells and Treg cells in the spleens and lymph nodes (LNs) of CIA mice treated with or without PGRN (n = 12 per group). Bar graphs represent means ± sd of total mice per group. B) ELISA analysis of sera levels of IL-10, IL-17, IL-6, and TNF-α in CIA mice treated with or without with PGRN for 5 wk. KO, knockout; ND, nondetectable. Values are means ± sd. *P < 0.05; **P < 0.01 vs. PBS-treated control group.

