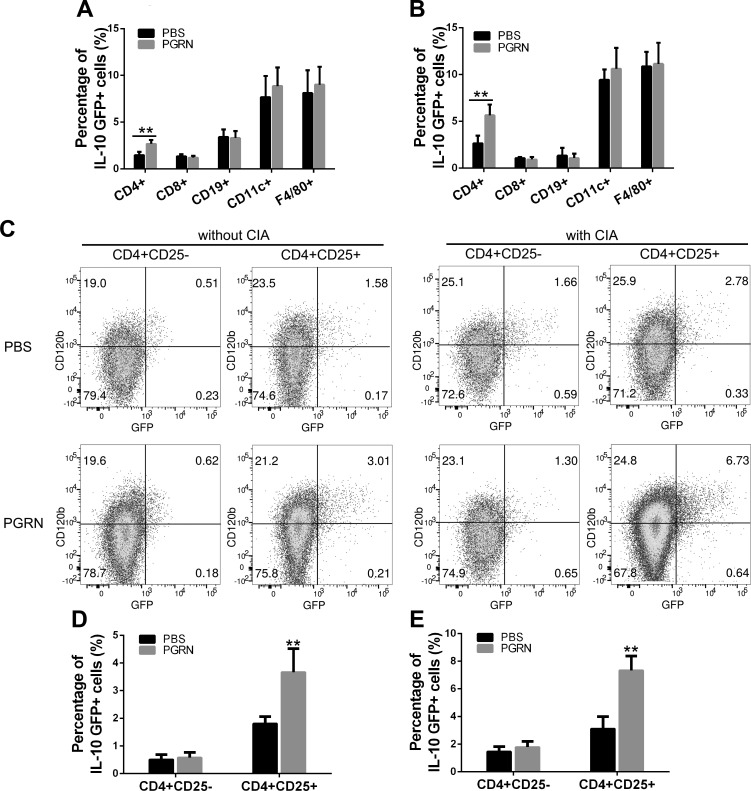
Figure 3.
Treg cells are a predominant new source of PGRN-induced IL-10. IL-10eGFP reporter mice were challenged with or without CIA, followed by treatment with PBS or PGRN (n = 12 per group). A, B) Splenocytes were stained with specific Abs to CD4, CD8, CD19, VD11c, or F4/80, then subjected to FACS analysis. Statistical analysis of the percentage of each cell type in response to PGRN under physiological (A) or inflammatory (B) conditions. Bar graphs represent means ± sd of total mice per group. C) Expression of IL-10eGFP and TNFR2 (also known as CD120b) on CD4+ T-cell subtypes. Dot plots are of individual mice, numbers in quadrants indicate percent cells in each. D, E) Statistical analysis of percentage of subtype of CD4+ T cells in response to PGRN under physiological (D) or inflammatory (E) conditions. Bar graphs represent means ± sd of total mice per group. **P < 0.01 vs. control group.

