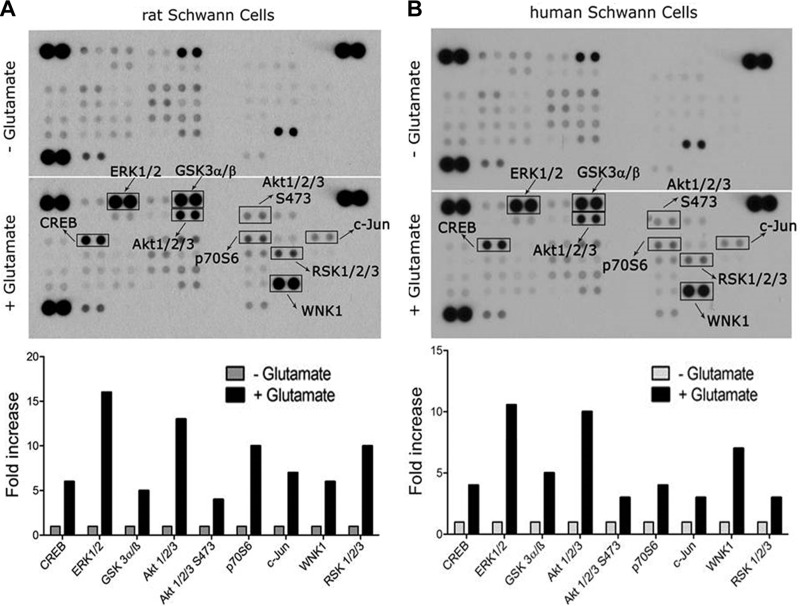
Figure 3.
Comprehensive analysis of protein phosphorylation in glutamate-treated SCs. A) rSCs were treated with 80 µM glutamate or with vehicle for 10 min. Protein phosphorylation was analyzed by array. Bar graph shows increases in protein phosphorylation associated with glutamate treatment compared with cells treated with vehicle. Although the majority of the presented phosphorylation events are activating, some, such as GSK-3, are inactivating. B) hSCs were treated with 80 µM glutamate or with vehicle for 10 min. Protein phosphorylation was determined by array.

