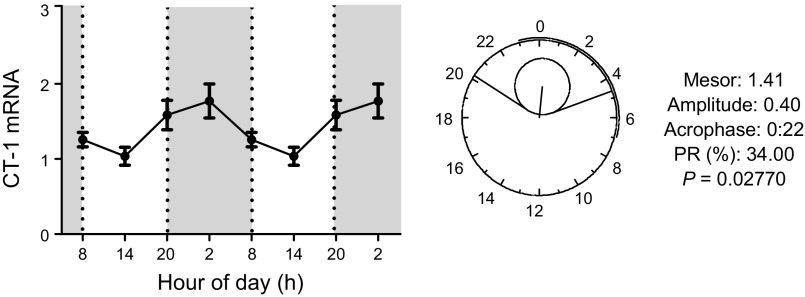
Figure 3.
Adipose tissue daily mRNA expression profile and cosinor analysis of CT-1. Around the clock gene expression levels of CT-1 in epididymal fat of 2-mo-old WT mice. Data are means ± sem (n = 4–6). Polar (clock-like) representation of the estimates of the parameters of the rhythm for CT-1 mRNA in the form of a 24-h clock in WT mice at 2 mo of age.

