
Figure 4. The crystal structure of the Fab 8A7 / CyRPA complex.
(A) Orthogonal views of the ribbon representation of the complex (CyRPA: green, Fab 8A7 light chain: cyan; Fab 8A7 heavy chain: yellow. (B) Hydrogen bond network within the interface between Fab 8A7 and CyRPA. (C) Surface of Fab 8A7 epitope of CyRPA colored according to surface potential (red negative, blue positive), with the Fab chain colored as in (A). Surface potential was computed using CHIMERA (Pettersen et al., 2004).
DOI: http://dx.doi.org/10.7554/eLife.21347.008
Figure 4—source data 1. Deduced hydrogen bonds between CyRPA and Fab 8A7.
Hydrogen bonds were computed using the program CONTACT within the CCP4 suite (Collaborative Computational Project N, 1994).
elife-21347-fig4-data1.docx (64.5KB, docx)
DOI: 10.7554/eLife.21347.009
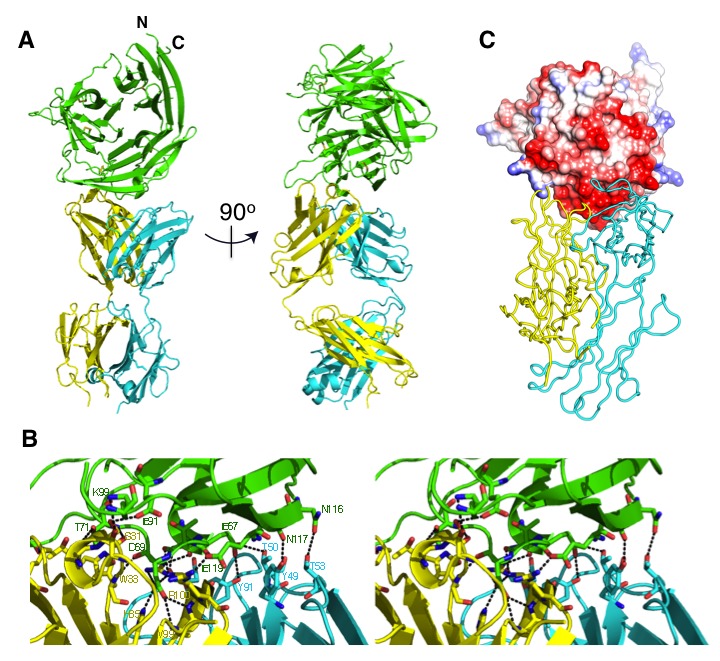
Figure 4—figure supplement 1. Amino acid sequence of anti-CyRPA monoclonal antibody 8A7 Fab fragment for both heavy and light chains.
