. 2017 Feb 21;6:e23485. doi: 10.7554/eLife.23485

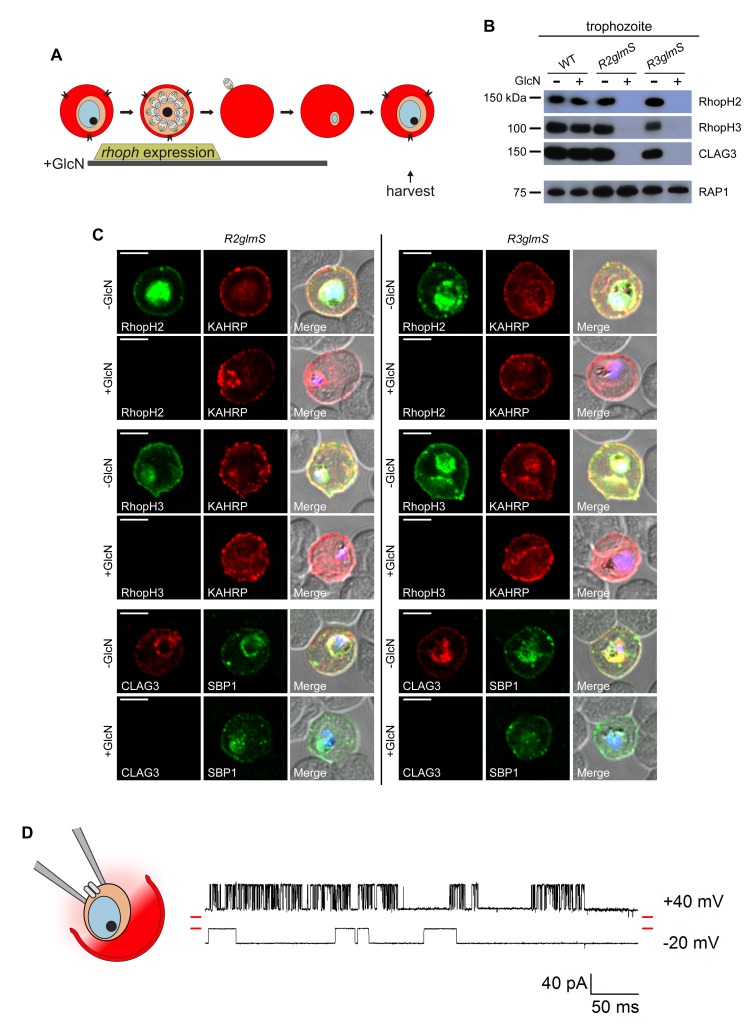
Figure 3. Transfer of intact complexes to new host cells and no role for RhopH proteins in vacuolar function.

(A) Schematic showing timeline for GlcN exposure, rhoph gene expression, and subsequent harvest of trophozoite-infected cells. (B) Immunoblots of matched lysates from trophozoite-stage parasites with or without exposure to 4 mM GlcN. Both knockdown parasites lack all three associated proteins, indicating that only intact complexes are transferred during host cell invasion. RAP1 does not depend on RhopH proteins for its transfer. (C) IFA of indicated proteins in R2glmS and R3glmS at the trophozoite stage. Each member of the complex is undetectable in GlcN-treated cells, but KAHRP and SBP1 are exported to the host compartment normally. Scale bars, 5 µm. (D) Single-channel patch-clamp recordings on the PVM of R3glmS after cultivation with 4 mM GlcN, showing stochastic transitions of the large conductance channel at this membrane. The RhopH complex is not required for this channel activity. The membrane potential at the patch (negative of the pipette potential) is indicated to the right of each trace; red dashes at both ends of traces correspond to the closed channel levels. 460 ms of recording is shown at each membrane potential. The schematic on the left shows a patch-clamp pipette sealed on the PVM after parasite extraction from a host erythrocyte.

DOI: http://dx.doi.org/10.7554/eLife.23485.005

Figure 3.

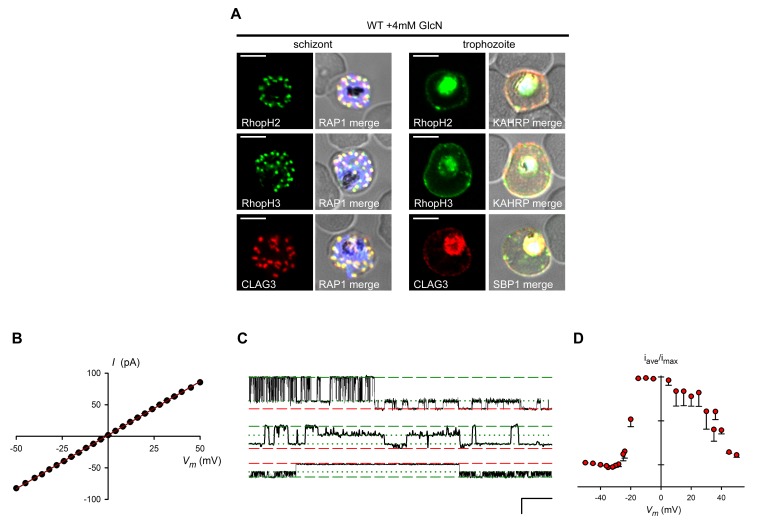
Figure 3—figure supplement 1. GlcN affects neither RhopH complex proteins in untransfected parasites nor PVM channel biophysical properties.

Figure 3—figure supplement 1.

(A) IFA of wild-type parasites grown with 4 mM GlcN. Schizont- and trophozoite-infected cells are shown for the indicated RhopH members. Colocalization with RAP1 indicates protein in schizont rhoptries. Colocalization with KAHRP and SBP1 indicates export to erythrocyte membrane in trophozoites. Scale bars, 5 μm. (B) Mean ± S.E.M. maximal open channel currents (I) for PVM channel recordings on R3glmS cultivated with 4 mM GlcN. Currents are shown at imposed membrane potentials (Vm, calculated as the negative of the pipette potential). The chord conductance, 1.7 nS, was determined by linear regression (solid line). (C) Single channel recordings from a PVM patch on R3glmS cultivated with 4 mM GlcN showing closed, open, and subconductance levels (red dashed, green dashed, and green dotted lines, respectively). Traces were recorded at membrane potentials of +40 mV, +35 mV, and −21 mV (top to bottom traces, respectively). Scale bar at bottom right represents 50 ms horizontal/30 pA vertical. (D) PVM channel open probability (mean ± S.E.M.) for R3glmS grown with 4 mM GlcN. Values were calculated as the mean time-averaged current divided by the maximal open channel current and plotted against imposed Vm.