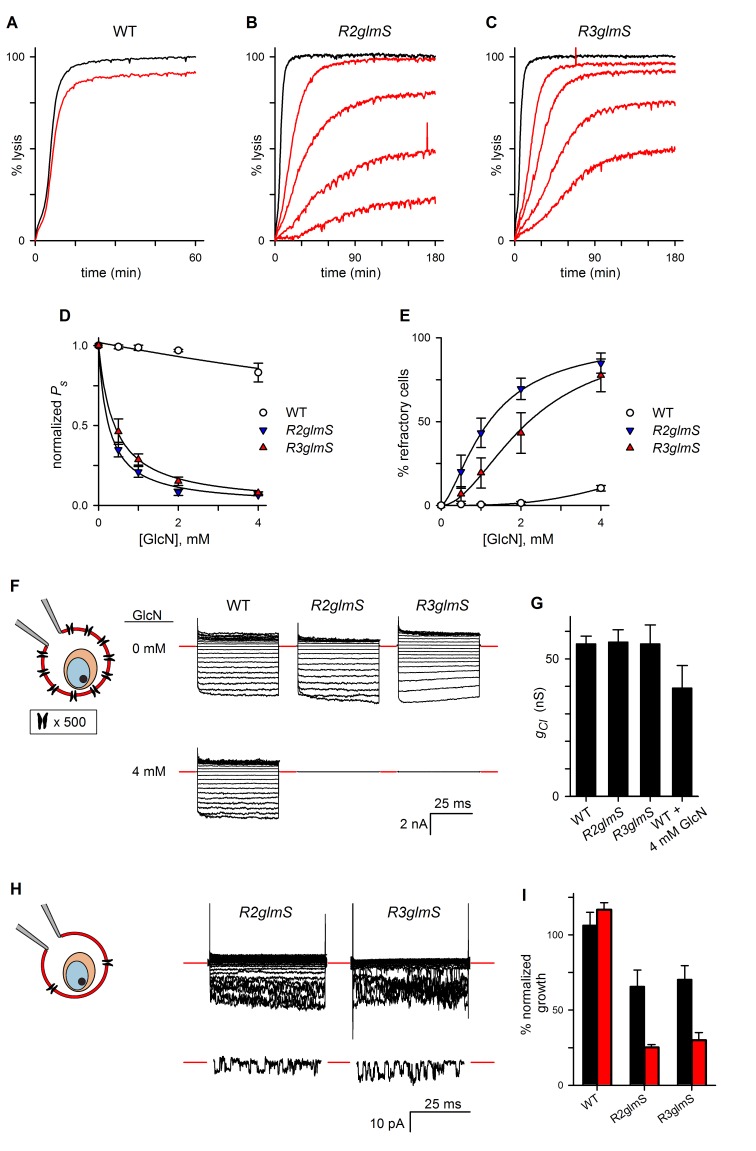
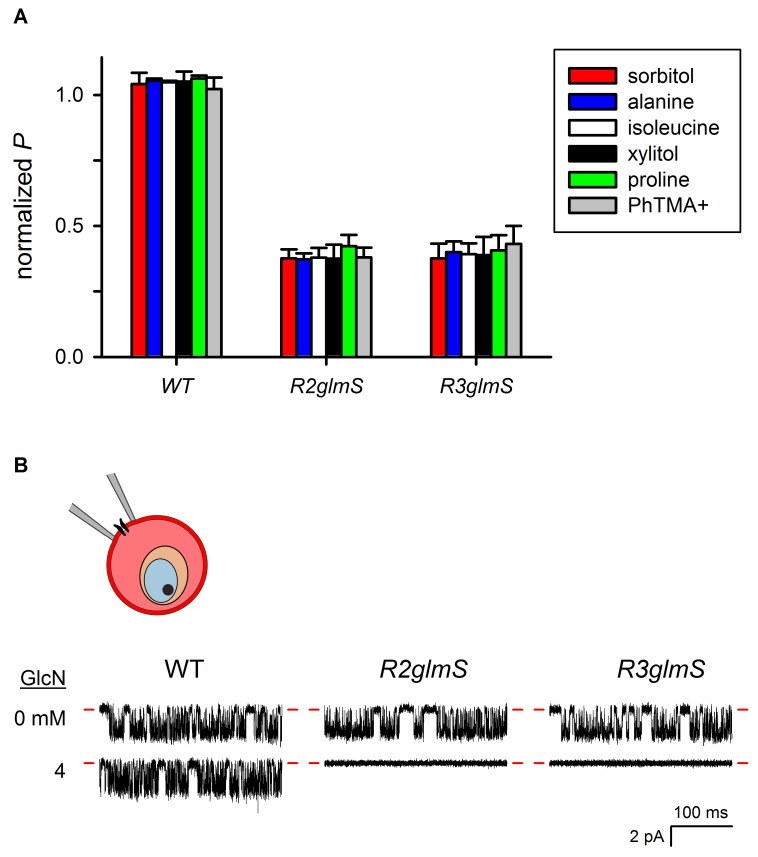
Figure 4. RhopH complex abundance correlates with PSAC activity.
(A) Osmotic lysis kinetics resulting from sorbitol uptake by wild-type parasites with or without exposure to 4 mM GlcN (red and black traces, respectively). (B–C) Lysis kinetics for transfectant parasites without (black) or with 0.5, 1, 2, or 4 mM GlcN (top to bottom red traces, respectively). Note the extended time scales for osmotic lysis. (D) Normalized sorbitol permeabilities (mean ± S.E.M.) for each parasite at indicated GlcN concentrations. Solid lines represent best fits to y = a/(1 + (x/K0.5)). (E) Percentage of cells refractory to osmotic lysis (mean ± S.E.M.) at each [GlcN]. Solid lines represent best fits to a two-parameter logistic curve. (F) Whole-cell currents from individual trophozoite-infected erythrocytes, presented as the ensemble responses to membrane voltages (Vm) between −100 and +100 mV in 10 mV increments. 4 mM GlcN specifically abolishes currents on knockdown parasites. Red dashes indicate zero current levels. The schematic on the left shows the whole-cell patch-clamp configuration; the recording pipette measures currents resulting from ion flow through channels on the cell surface; the measured currents correspond to ~4000 channels on infected cells not subjected to GlcN knockdown. (G) Chord conductances (gCl) (mean ± S.E.M.) for each parasite without GlcN, calculated from whole-cell currents between Vm of 0 and −100 mV. Statistics were calculated from up to 15 cells each. The value for wild-type cells after 4 mM GlcN treatment is also shown. (H) Whole-cell ensemble currents for transfectants cultivated with 4 mM GlcN, taken from panel (F) but presented at an increased gain. Single traces beneath each ensemble show stochastic transitions that are due to openings of individual channels detected in the whole-cell configuration; Vm, −90 and −70 mV for traces shown at bottom in R2glmS and R3glmS, respectively. These transitions and the reduced ensemble amplitudes indicate a marked reduction in PSAC copy number. Horizontal and vertical scale bars represent 25 ms and 10 pA, respectively, for all traces. The schematic on the left shows the whole-cell patch-clamp configuration and a reduced number of channels. (I) Parasite growth (mean ± S.E.M.) over 72 hr in standard medium or PGIM (black and red bars, respectively) after exposure to 1 mM GlcN. For each parasite, growth was normalized to 100% for matched controls using the same parasite and culture medium without GlcN treatment.


