. 2017 Feb 10;6:e19272. doi: 10.7554/eLife.19272

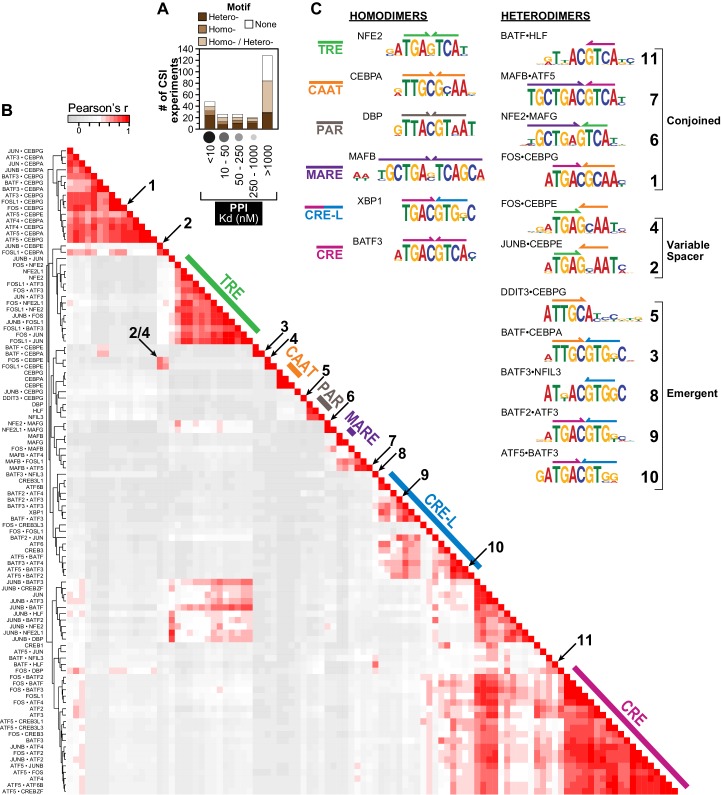
Figure 1. Overview of human bZIP homodimer and heterodimer DNA-binding specificities.

(A) Summary of SELEX-seq results categorized by protein-protein interaction (PPI) affinity (Reinke et al., 2013). Specificity profiles were classified as resulting in a motif arising from DNA binding by either a homodimer (brown) or a heterodimer (dark brown), or not resulting in a motif (white). Some profiles could not be unambiguously assigned to a homo vs. heterodimer (light brown). (B) Pairwise comparisons of the DNA-binding preferences of 102 bZIP dimers (22 homodimers and 80 heterodimers) using the z-scores for 1222 unique 10 bp sequences corresponding to the 50 top ranked sequences for each dimer. Throughout the paper, the biotinylated bZIP is listed first when describing a heterodimer. (C) Representative motifs bound by bZIP homodimers and heterodimers reported in this study. Heterodimer motifs were grouped as Conjoined, Variable spacer, and Emergent. The color code defined here for half sites (colored arrows above motifs) is used throughout the figures.

DOI: http://dx.doi.org/10.7554/eLife.19272.003

Figure 1—source data 1. Data for Figure 1C.
Pairwise comparison (Pearson's correlation) of the DNA-binding preferences of 102 bZIP dimers using the CSI intensity for 1222 10 bp sequences.
elife-19272-fig1-data1.xlsx (120.7KB, xlsx)
DOI: 10.7554/eLife.19272.004

Figure 1.

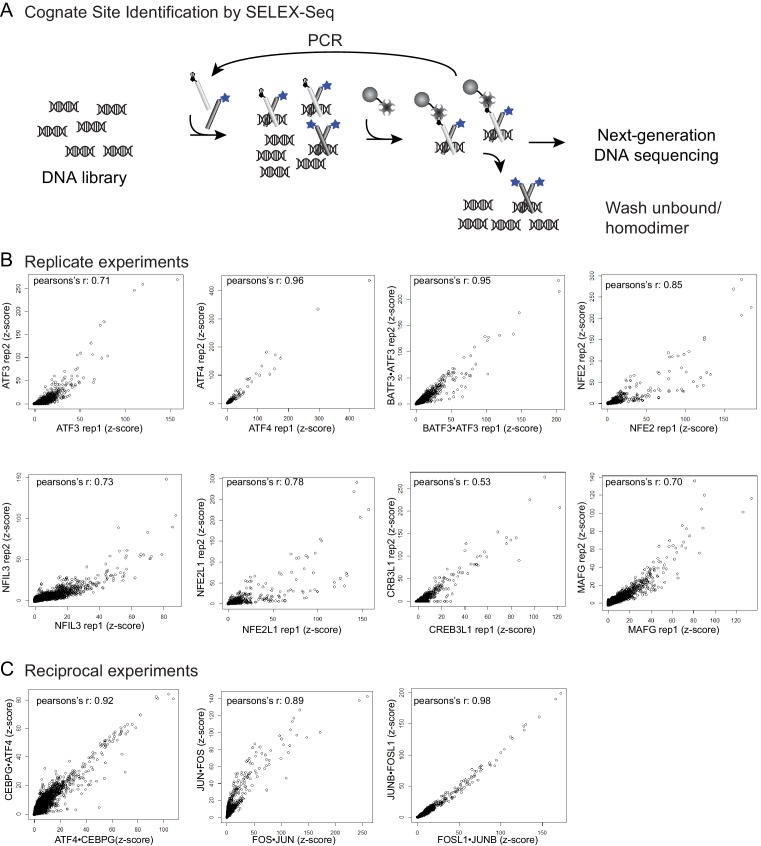
Figure 1—figure supplement 1. Cognate site identification by SELEX-sequencing.

Figure 1—figure supplement 1.

(A) In CSI by SELEX-seq, a DNA library with a randomized 20 bp region is incubated with a bZIP pair in which one bZIP partner (light grey) was biotinylated and the other partner (light grey) was labeled with fluorescein (blue star). bZIP partners were mixed in 3:1 molar ratios with the biotinylated partner at the lower concentration. Affinity purification using the less abundant biotinylated partner enriched for heterotypic dimers. (B) Reproducibility of CSI by SELEX-Seq. Scatter plots of CSI intensities (z-scores) for all 10-mers for replicate samples and (C) reciprocal samples.

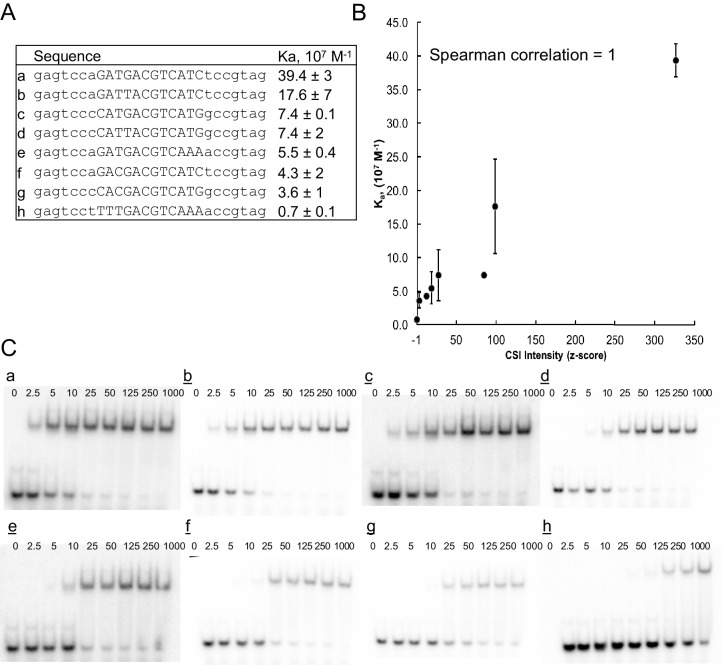
Figure 1—figure supplement 2. ATF3 CSI Intensity (z-score) correlates with equilibrium association constant.

Figure 1—figure supplement 2.

(A) DNA sequence of oligonucleotides used for determining binding constants. (B) Correlation between CSI intensity (z-score) and association constant (Ka) for ATF3. Binding constants were measured by EMSA. Error bars are ± S.D. of at least duplicate measurements. (C) Representative autoradiographs of EMSA experiments from which binding constants were calculated using non-linear regression.

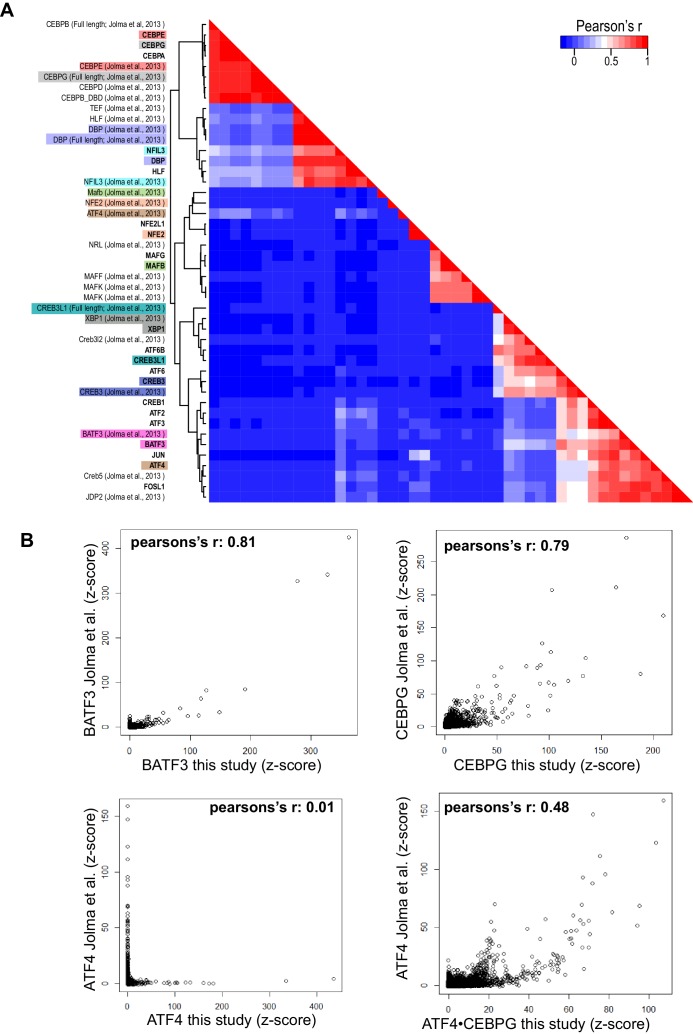
Figure 1—figure supplement 3. Pairwise comparison of bZIP homodimers reported in this study and bZIP dimers reported by Jolma et al.

Figure 1—figure supplement 3.

(Jolma et al., 2013). (A) Hierarchical clustering was performed using the CSI intensities (z-scores) of 871 unique 10 bp sequences corresponding to the 50 top ranked sequences identified from each dimer. Corresponding bZIP pairs are highlighted in matching color. (B) Scatter plots comparing CSI intensity (z-score) for all 10-mers of bZIP dimers from this study with bZIP dimers previously reported by Jolma et al. (2013). (top left) BATF3 vs. BATF3; (top right) CEBPG vs. CEBPG; (bottom left) ATF4 vs. ATF4; (bottom right) ATF4 vs. ATF4•CEBPG.

Figure 1—figure supplement 4. bZIP heterodimer specificity.

Figure 1—figure supplement 4.

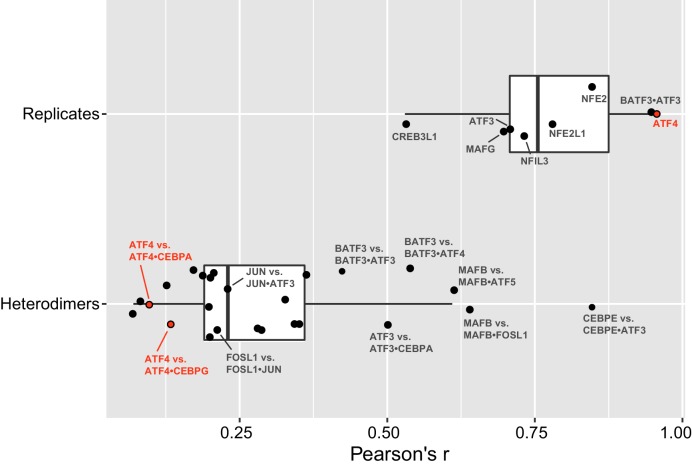
Pearson’s correlations (r) of all 10-mers between replicate experiments of bZIP dimers (top), and correlations between a bZIP heterodimer and the bZIP homodimer that was used to pull-down the heterodimer. The average (± standard deviation) Pearson’s correlation (r) for eight replicate samples was 0.8 ± 0.1.

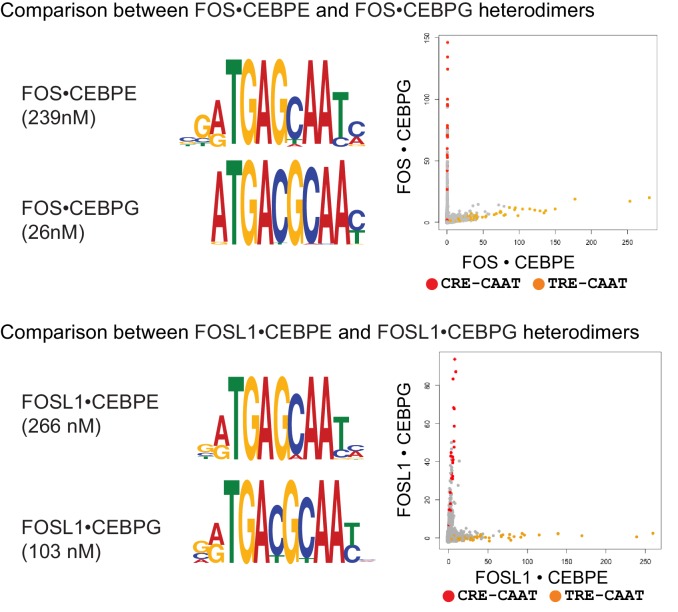
Figure 1—figure supplement 5. DNA sequence preferences for FOS•CEBPE, FOS•CEBPG, FOSL1•CEBPE, and FOSL1•CEBPG.

Figure 1—figure supplement 5.

Left, PPI affinity for the corresponding heterodimer is shown. Middle, MEME motifs are represented as DNA logos. Right, 2-dimensional scatter plots comparing the CSI intensities for all 10-mers. CRE/CAAT (TGACGTAA) sites are colored red, and TRE/CAAT (TGAGCAA) sites are colored orange.