. 2017 Feb 10;6:e19272. doi: 10.7554/eLife.19272

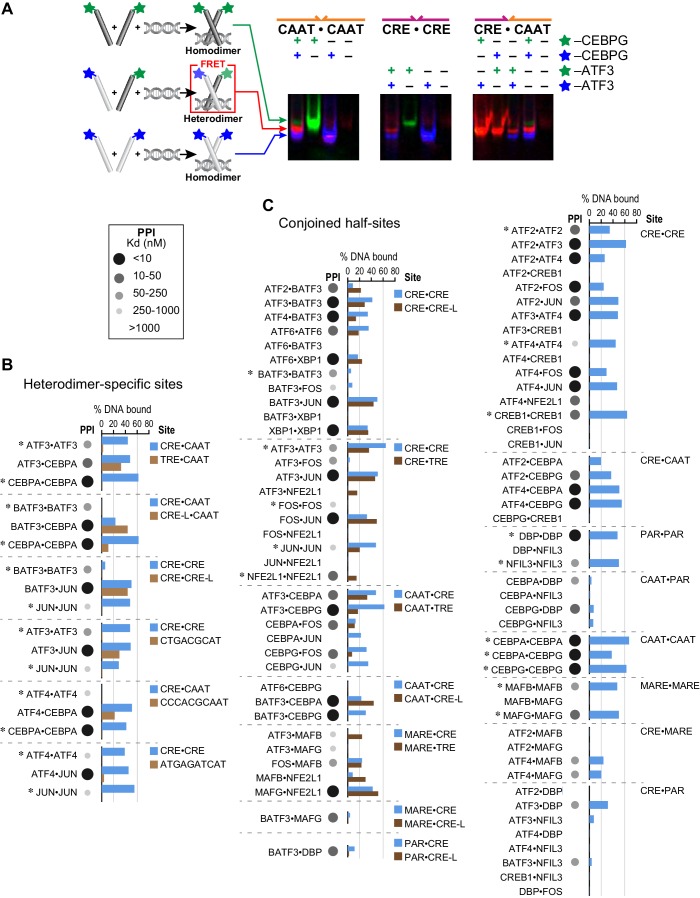
Figure 3. Influence of bZIP protein dimerization on DNA binding.

(A) EMSA-FRET assay used to quantify bZIP heterodimers and homodimers binding to DNA. Fluorescein and TAMRA are depicted as blue and green stars, respectively. In the EMSA gel, homodimers give rise to pseudo-colored blue (fluorescein) or green (TAMRA) signals, whereas heterodimers give a FRET signal that is pseudo-colored red. (B) EMSA-FRET results for bZIP dimers binding to selected heterodimer-specific emergent sites (brown) and conjoined half-sites (blue). Bar graphs show the percent of the indicated DNA oligomer bound by each dimer. The PPI strength of each dimer is indicated with gray-scale circles sized according to the Kd for a given protein-protein interaction. Homodimers are marked with an asterisk (*). (C) EMSA-FRET results for bZIP dimers tested for binding to DNA sites composed of conjoined half-sites. Left, dimers tested against two different sites composed of conjoined half-sites. Right, dimers tested against a single site. Data are displayed as in B.

DOI: http://dx.doi.org/10.7554/eLife.19272.012

Figure 3.

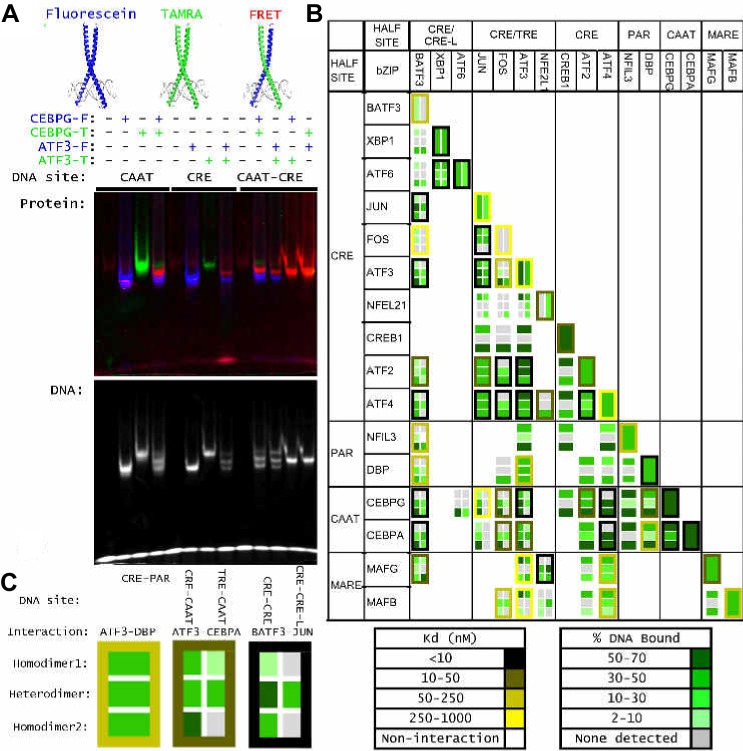
Figure 3—figure supplement 1. Influence of bZIP protein dimerization on DNA binding.

Figure 3—figure supplement 1.

(A) Detecting heterodimer DNA complexes using an EMSA-FRET assay. Top, Fluorescein signal in blue, TAMRA signal in green, and FRET signal in red. Bottom, TYE 665 labeled DNA site. (B) Three examples to explain the notation used in part C summarize data for DNA binding by homodimers and heterodimers composed of (left) ATF3 and DBP, (middle) ATF3 and CEBPA and (right) BATF3 and JUN. Within each example, rows indicate different bZIP dimers. The top row describes the homodimer formed by the first-mentioned bZIP, the bottom row is for the other homodimer, and the middle row contains data for the heterodimer. Within each example, each column represents binding to a different DNA site composed of two half-sites. DNA-binding affinity is indicated using a green-scale heatmap with key indicating % binding at far right. The color of the cell border indicates strength of the protein-protein interaction as measured previously by FRET, indicated by yellow-scale heatmap at right. ATF3•DBP example: top row is ATF3 binding to CRE-PAR, middle row is ATF3 • DBP heterodimer binding to CRE-PAR, bottom is DBP homodimer binding to CRE-PAR. ATF3•CEBPA example: Top row is ATF3 homodimer, middle row is ATF3 • CEBPA heterodimer, and bottom row is CEBPA homodimer. Binding is to CRE-CAAT in left column and TRE-CAAT in right column. BATF3•JUN example: Top row is BATF3 homodimer, middle row is BATF3 • JUN heterodimer and bottom row is JUN homodimer. Binding is to CRE-CRE in left column and CRE-CREA in right column. (C) Complete set of EMSA-FRET data. Examples in B are included in this grid and other cells can be interpreted analogously.
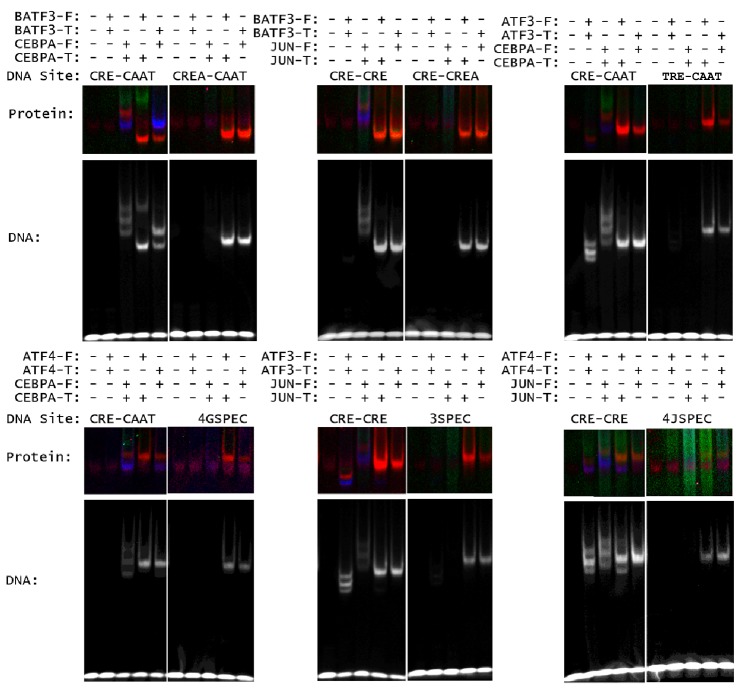
Figure 3—figure supplement 2. Heterospecific binding of DNA.

Figure 3—figure supplement 2.

Top, DNA sequences composed of optimal half sites. Bottom, comparison of an optimal DNA site to a heterodimer-specific non-optimal DNA site. DNA sequences for EMSA-FRET experiments are reported in Supplementary file 1D.