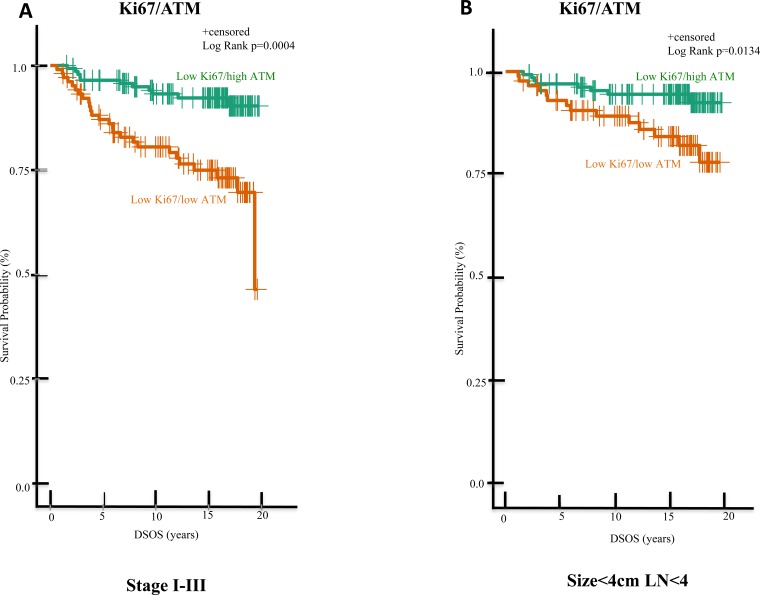
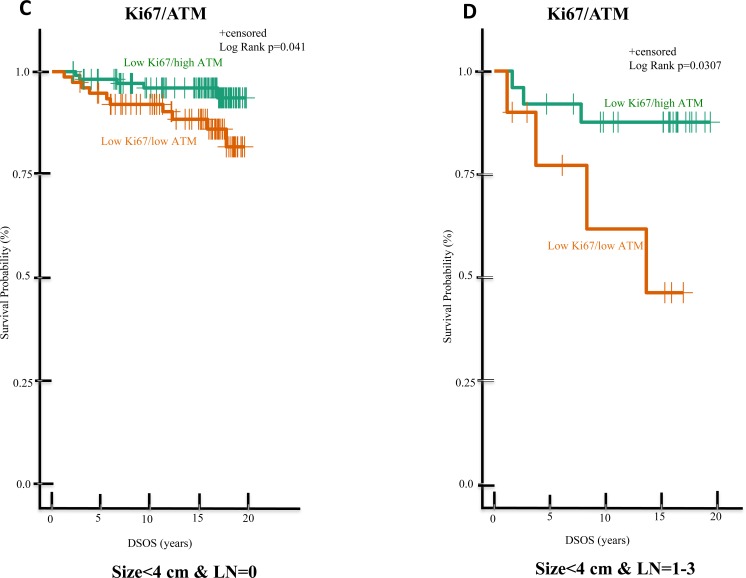
Figure 4. In the low Ki67 subgroup of ES-HPBC, patients with high ATM vs low ATM expression significantly differ in DSOS.
Shown are Kaplan-Meier analysis of DSOS of ES-HPBC patients with A. stage I-III tumors and low Ki67 expression; B. low Ki67 expression, smaller tumors (size < 4 cm) and fewer positive nodes (LN < 4), C. no positive nodes, low Ki67, and smaller tumors (size < 4 cm), D. low Ki67, smaller tumors (size < 4 cm) and LN = 1-3.


