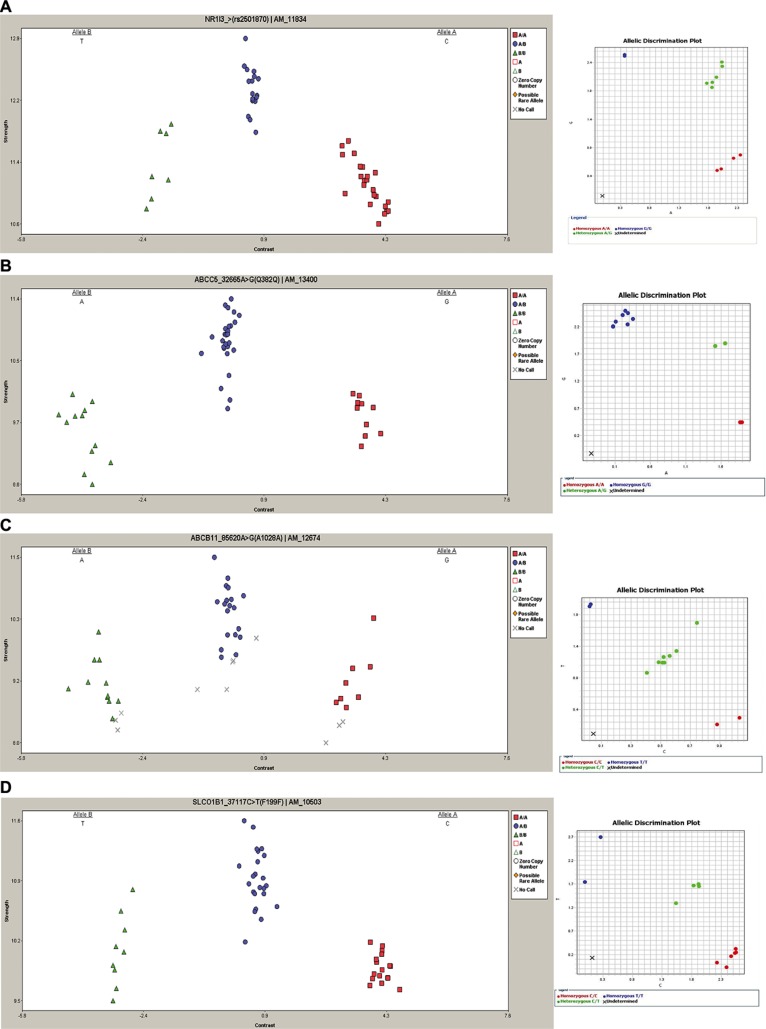
Figure 1. Representative DMET results and TaqMan SNP validation assay.
Left column: cluster graphs from DMET Console software displaying the signal data of all 49 samples genotyped for rs2501870, NR1I3 (A), rs7636910, ABCC5 (B), rs497692, ABCB11 (C) and rs2291075, SLCO1B1 (D). In rs2501870, rs497692 and rs7636910 alleles are reported in reverse orientation to genome. Right column: representative allelic discrimination plot (right column) generated from ViiA7 Real-Time PCR System software showing allelic symbols for rs2501870 (A), rs7636910 (B), rs497692 (C), rs2291075 (D) evaluation. In the plot the symbol “X” is referred to the No Template Control.

