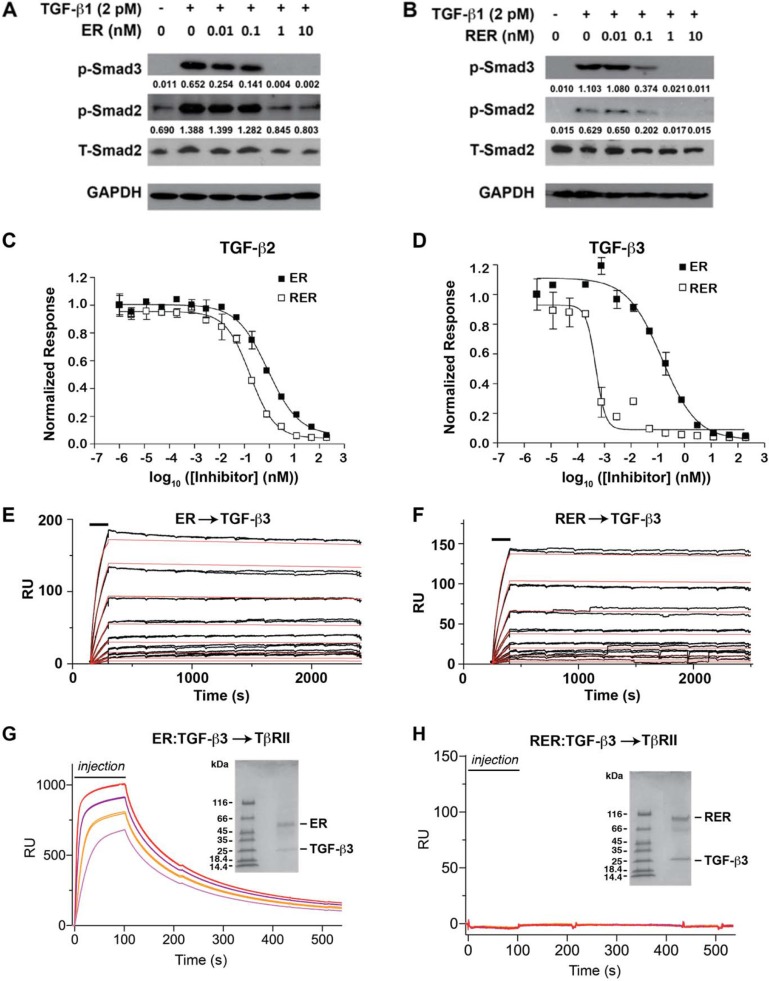
Figure 2. ER and RER antagonism of TGF-β signaling and mechanism of action.
(A–B) Western blots for phopho-Smad2 (p-Smad2) and phospho-Smad3 (p-Smad3) to qualitatively assess the potency of the ER and RER receptor traps as TGF-β1 antagonists. Blots were stripped and re-probed using either a Smad2 antibody (total Smad2 or T-Smad2) or glyceraldehyde-3-phosphate dehydrogenase (GAPDH) to control for equal loading. The value under each p-Smad2 and p-Smad3 band was normalized-density by the density of the corresponding T-Smad2 band with ImageJ program. (C–D) TGF-β PAI-1 luciferase reporter activity upon treatment of stably transfected cultured mink lung epithelial cells with 20 pM TGF-β2 or TGF-β3 as a function of increasing receptor trap concentration. Data points and associated error bars correspond to the mean and standard deviation among triplicate measurements. Smooth lines correspond to fits of the data to a standard equation for inhibition with variable slope. (E–F) Injection of the ER or RER receptor trap as a two-fold dilution series (12.5–400 pM) over immobilized TGF-β3. Injections were performed in triplicate and are indicated by black bars. Raw sensorgrams are shown in black. Global fit of the raw data to a 1:1 binding model is shown as smooth red curves. (G–H) SPR sensorgrams for injection of 0.5 μM (pink), 1 μM (orange), 2 μM (purple), and 4 μM (red) pre-purified TGF-β3:ER or TGF-β3:RER complexes over immobilized TβRII (G and H, respectively). SDS-PAGE gels of the injected complexes are shown in the insets.

