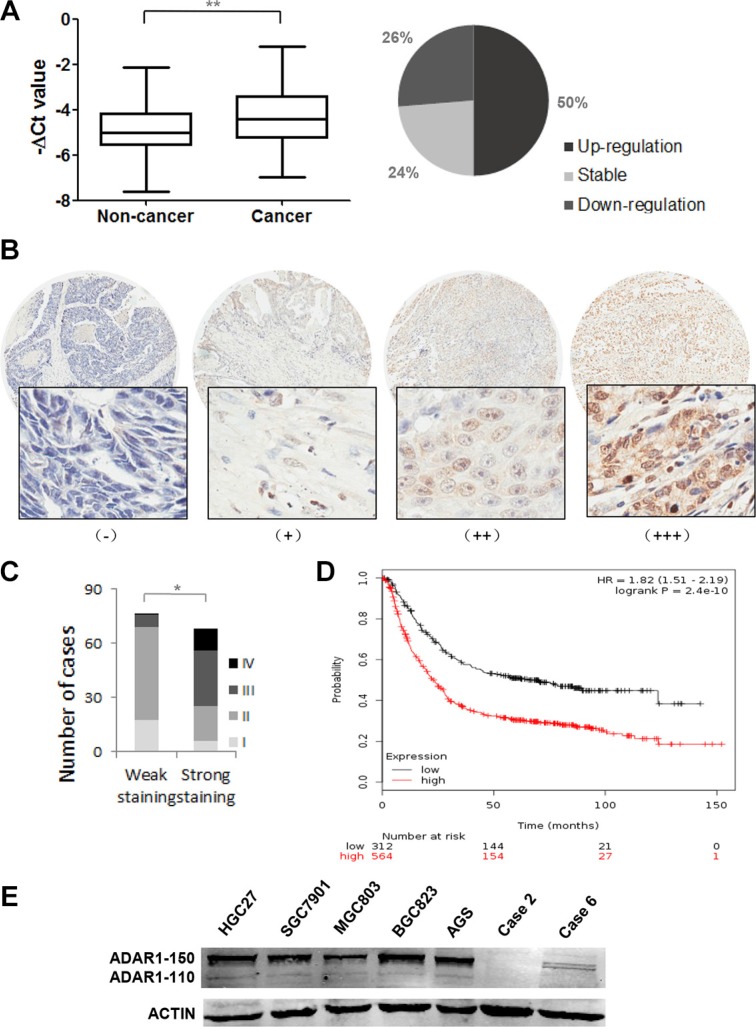
Figure 1. Expression pattern of ADAR1 in gastric cancer tissues and cell lines.
(A) The mRNA expression of ADAR1 was measured in 38 paired gastric cancer samples and adjacent, non-cancerous stomach tissues by quantitative real-time-PCR. Data is shown as –ΔCt, where β-actin was used as internal control. P value was calculated by Student's t test, **P < 0.01. (B) The protein expression of ADAR1 was performed with immunohistochemical staining on a gastric cancer tissue microarray with anti-ADAR1 antibody. (−), representative sections of negative staining; (+), slight positive; (++), moderate positive; (+++), strong positive. Magnification: × 40 (upper) and × 200 (bottom). (C) The positive ratio of ADAR1 staining in TNM stage I, II, III and IV. Weak staining includes (−) and (+); strong staining includes (++) and (+++). *P < 0.01. (D) Kaplan-Meier overall survival plot comparing patients demonstrating high ADAR1 expression (black line; n = 564) and low ADAR1 expression in tumors (red line; n = 115; P < 0.01, Log-rank test). (E) The expression of ADAR1 was evaluated by western blot in five gastric cancer cell lines and two random adjacent non-cancerous stomach tissues.

