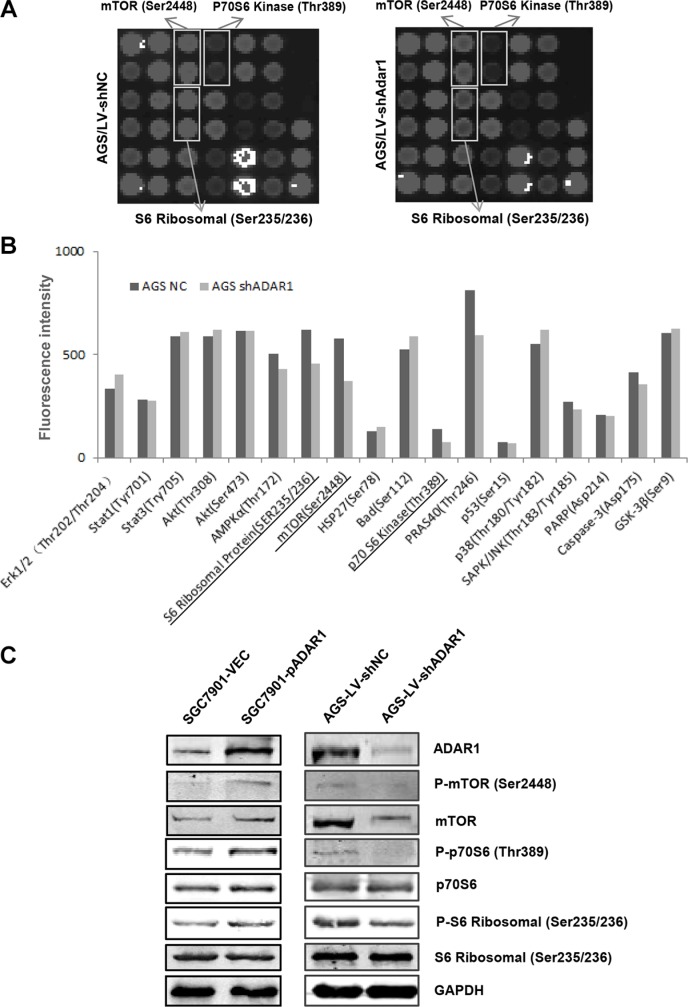
Figure 6. Effects of ADAR1 on the phosphorylation level of mTOR signaling in GC cells.
(A) Intracellular signaling array was performed in AGS cells before and after silencing ADAR1. The significantly changed protein dots were marked with rectangles. (B) Data quantified by Image Studio Version 3.1 for each protein dots of intracellular signaling array used above. (C) Western blot analysis was used to confirm the phosphorylation level change of mTOR, p70S6 kinase and S6 ribosomal protein in SGC7901 cells (for ADAR1 overexpression) and AGS cells (for ADAR1 knockdown).

