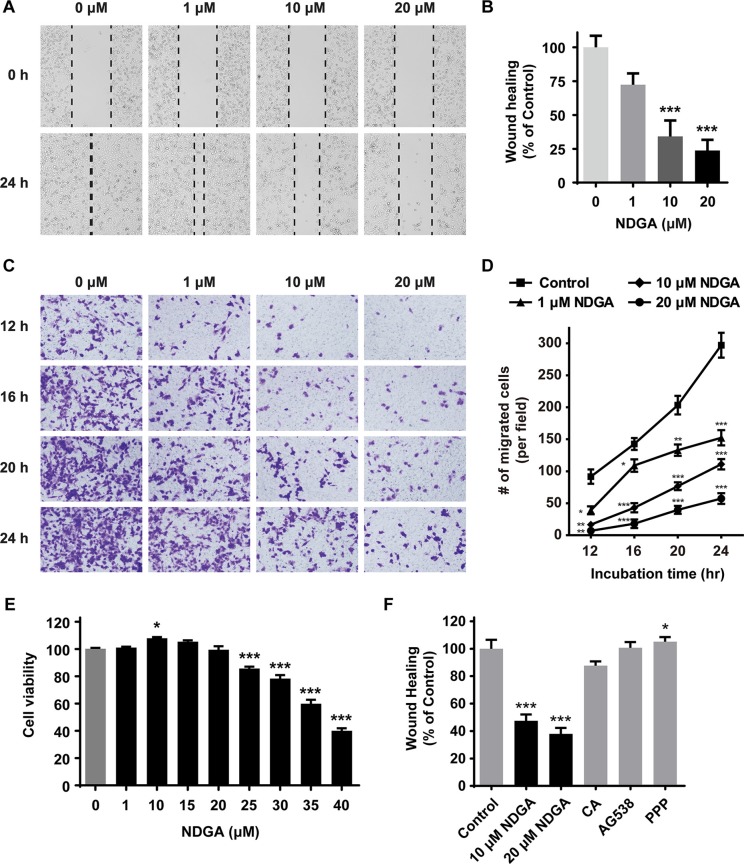
Figure 1. NDGA suppresses cell migration of PC3 cells.
(A) Wound healing assay of PC3 cells treated with different concentrations (0, 1, 10, 20 μM) of NDGA for 24 hours. Representative wound images of each group are shown. (B) Quantification of wound healing assay. Migration distance were normalized to control group. Data show mean ± S.E (n = 3). ***, p < 0.001. (C) Transwell assay of cells treated with NDGA for 12, 16, 20 or 24 hours. Representative images of migrated cells of each group are shown. (D) Quantification of transwell assay. Data show mean ± S.E (n = 3). *p < 0.05, **p < 0.01, ***p < 0.001. (E) Cells were treated with indicated doses of NDGA for 24 hours. Cell proliferation was determined using MTS assay. *p < 0.05, ***p < 0.001. (F) Wound healing assay was used to measure PC3 cells migration in the presence of NDGA (10 or 20 μM), 30 μM caffeic acid (CA), 4 μM AG538 or 4 μM picropodophyllin (PPP) for 24 hours. Data show mean ± S.E (n = 3). *p < 0.05, ***p < 0.001.

