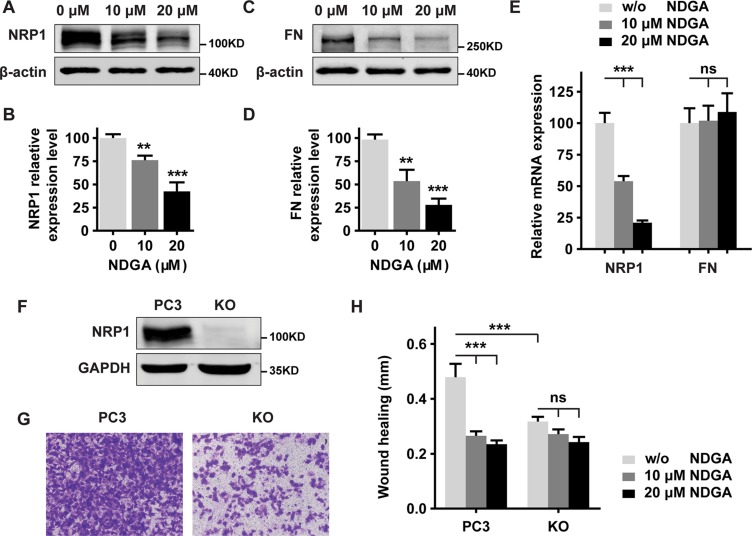
Figure 3. NDGA inhibits cell migration by suppressing NRP1 expression.
(A–D) Western blot analysis of PC3 cells proteins expression of NRP1 (A, B) and FN (C, D) with β-actin as the loading control. Statistical quantification of protein expression is shown as mean ± S.E (n = 3). **p < 0.01, ***p < 0.001. (E) mRNA expression levels of NRP1 and FN in PC3 cells measured by real time PCR. Data show mean ± S.E (n = 3). ***p < 0.001. (F) Verification of knockout efficiency in NRP1 knockout (KO) cell line generated from PC3 cells. (G) Cell motility of PC3 and KO cells evaluated by transwell assay. (H) Wound healing assay of PC3 and KO cells treated with NDGA for 24 hours. Quantification shows the absolute distance of migration presented as mean ± S.E (n = 3). ***p < 0.001.

