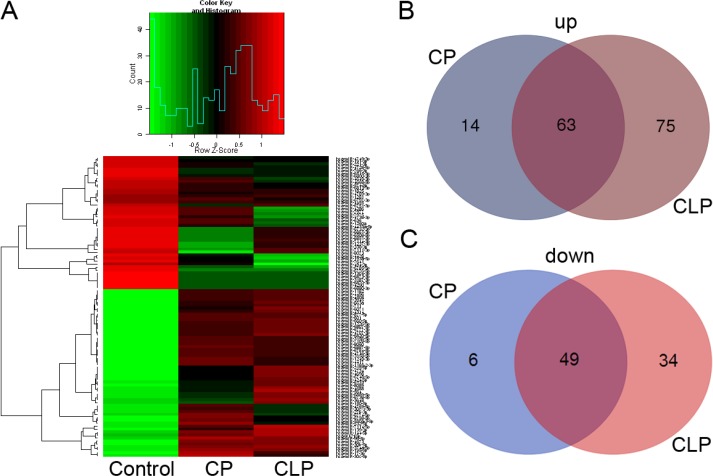
Figure 1. plasma miRNA microarray expression data among the patients with nonsyndromic cleft palate, nonsyndromic cleft lip with cleft palate and healthy children.
(A) Hierarchical clustering reveals the miRNA expression profile. (B) Venn diagrams show the number of distinct and overlapping upregulated miRNAs in CP and CLP. (C) Venn diagrams show the number of distinct and overlapping downregulated miRNAs in CP and CLP.

