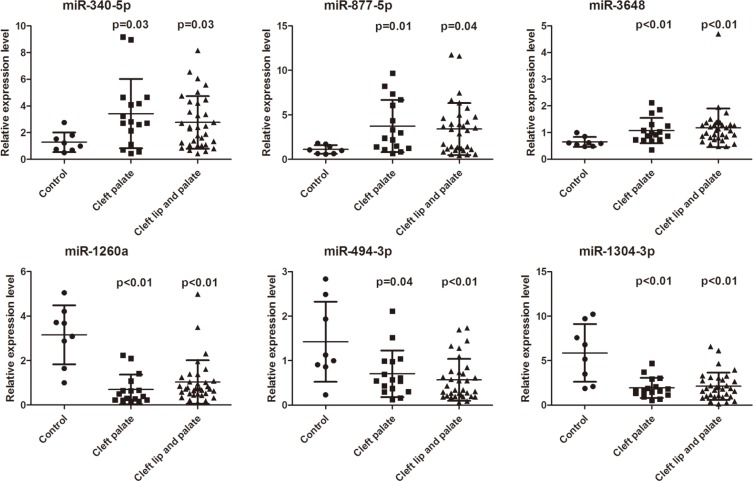
Figure 2. Relative expression level (2−ΔΔCt) of miR-340-5p, miR-877-5p, miR-3648, miR-1260a, miR-494-3p, and miR-1304-3p expression in the plasma of cleft palate patients (n =16), cleft lip with cleft palate patients (n = 33) and controls (n = 8) (Mann-Whitney U test).
P values are listed above the data dot.

