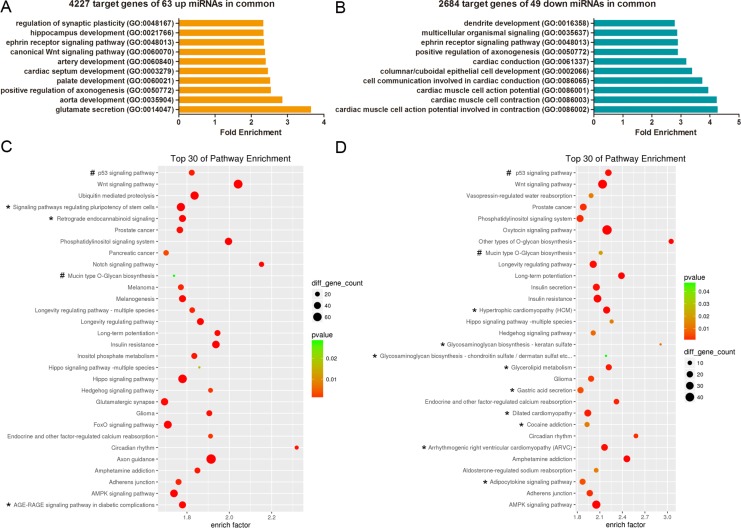
Figure 3. GO and KEGG pathway analyses show the associated function of the target genes of the miRNAs dysregulated in both CP and CLP.
(A) The top 10 enriched GO terms for the 4227 target genes of the 63 miRNAs upregulated in both CP and CLP. (B) The top 10 enriched GO terms for the 2684 target genes of the 49 miRNAs downregulated in both CP and CLP. (C) The top 30 enriched pathways for the 4227 target genes of the 63 miRNAs upregulated in both CP and CLP. (D) The top 30 enriched pathways for the 2684 target genes of the 49 miRNAs downregulated in both CP and CLP. (C-D) The enrichment P values were calculated using Fisher's exact test. The term/pathway on the vertical axis was drawn according to the first letter of the pathway name in descending order. The horizontal axis represents the enrichment factor, i.e., (the number of dysregulated genes in a pathway/the total number of dysregulated genes)/(the number of genes in a pathway in the database/the total number of genes in the database). The top 30 enriched pathways were selected according to the enrichment factor value. The selection standards were the number of genes in a pathway ≥ 4 and p < 0.05. The different colours from green to red represent the p-value. The different sizes of the round shapes represent the gene count number in a pathway. *indicates the pathway is similarly regulated in both CP and CLP. # means the pathway is regulated in both CP and CLP but the miRNA target genes may be upregulated or downregulated.

