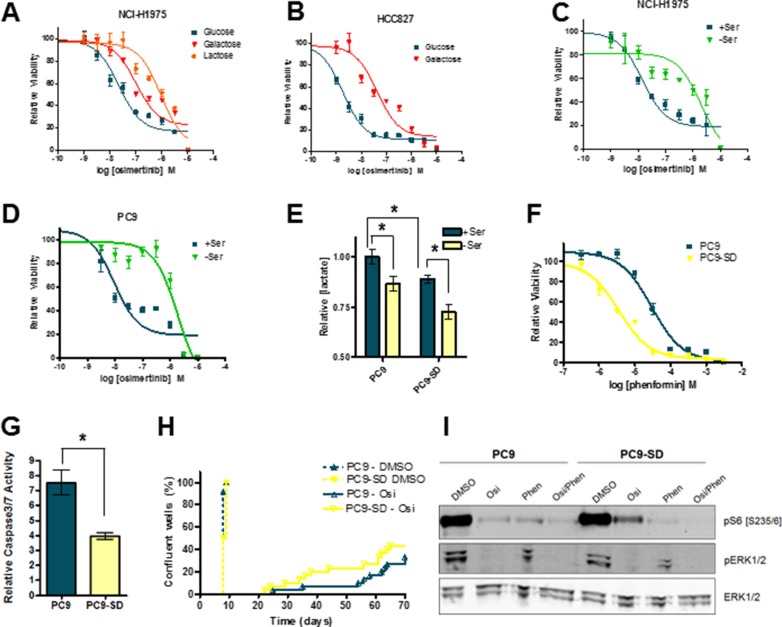
Figure 5. Growth conditions which promote OxPhos confer a degree of osimertinib resistance to EGFRm cell lines.
(A) Growth response curve for NCI-H1975 cells grown in DMEM containing 5 mM glucose, galactose or lactose. (B) Growth response curve for HCC827 cells grown in DMEM containing 5 mM glucose or galactose. Osimertinib growth response curve for NCI-H1975 (C) or PC9 (D) cells grown in either SFM (-Ser) or SFM with serine and glycine added back (+Ser). (E) PC9 and PC9-SD cells were grown in either -Ser or +Ser for 24h, and conditioned media was analysed for lactate concentration. Values shown are means relative to PC9 cells grown +serine +/− SEM (*p < 0.05; n = 3). (F) Osimertinib growth response curve for PC9 vs. PC9-SD cells grown in RPMI medium. (G) PC9 and PC9-SD cells were treated with 160 nM osimertinib or vehicle control for 48 h in RPMI medium and subjected to a caspase 3/7 assay as described in the Materials and Methods. Values shown are means relative to vehicle control +/− SEM (*p < 0.05; n = 3). (H) PC9 and PC9-SD cells were plated at low density, treated with the 160 nM osimertinib or vehicle control and scored for resistance as described in the Materials and Methods. (I) PC9 and PC9-SD cells were treated with vehicle control, 160 nM osimertinib, 30 μM phenformin or an osimertinib/phenformin combination for 24 h. Cells were lysed and subjected to Western blotting.

