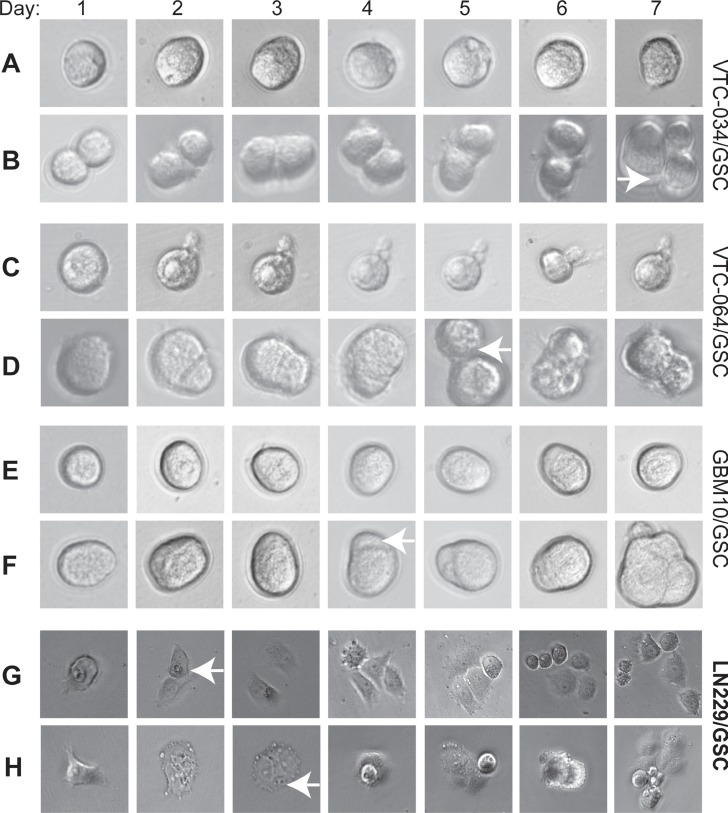
Figure 3. Dividing of single GSCs.
Single VTC-034/GSCs (A–B), VTC-064/GSCs (C–D), GBM10/GSCs (E–F), adherent LN229/GSCs (G–H) were plated and imaged using a 40X lens of an inverted microscope every day for seven consecutive days. Cropped images are shown. Images of adherent LN229/GSCs were in a different scale in order to show more cells. White arrows indicate the two-cell stages.

