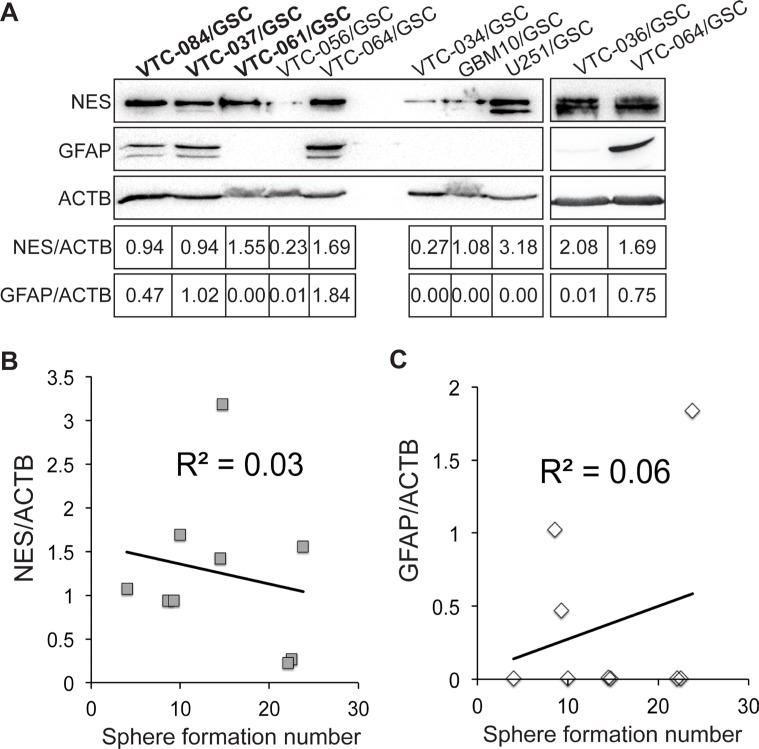
Figure 4. Expression of nestin and GFAP in GSCs.
(A) The protein levels of nestin (NES) and GFAP. β-actin (ACTB) was used as the loading control. Band intensities were quantified using Image J software. The ratios of NES/ACTB are shown. Correlations between sphere formation numbers and the protein levels of nestin (B) or GFAP (A–C) were determined using the linear regression model. Coefficients of determination (R2) are shown.

