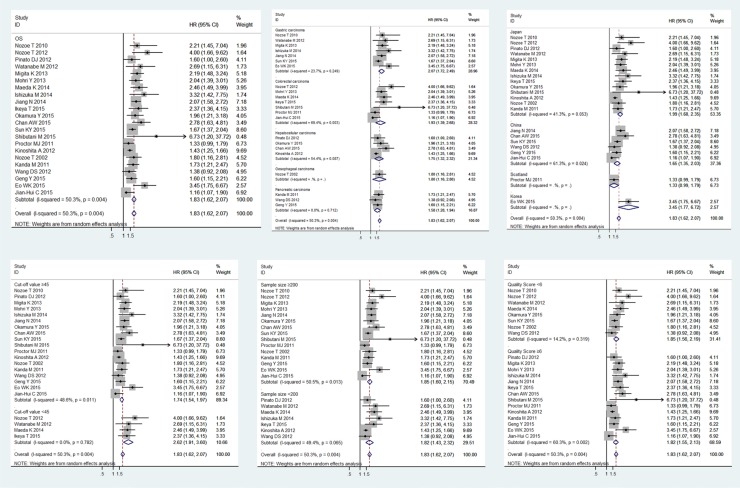
Figure 2. Meta-analysis of the associations between the PNI and OS.
The segments represent the 95% CIs of each study. The diamonds represent the overall effect sizes, and the diamond widths represent the overall 95% CIs. (A) OS; (B) tumor type; (C) region; (D) cut-off value; (E) sample size; (F) quality score.

