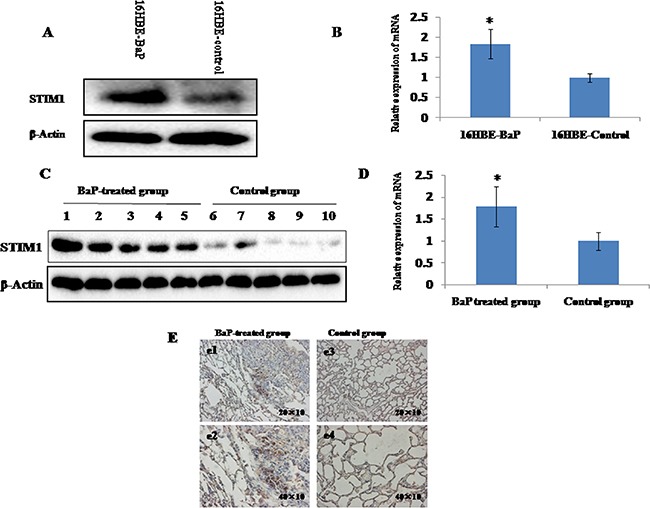
Figure 2. STIM1 expression in malignant 16HBE cells transformed by BaP and BaP-treated mice lung tissues were measured by qRT-PCR and western blot assay.

The levels of STIM1 protein A. and mRNA B. were higher in malignant 16HBE cells transformed by BaP than those in control cells. The levels of STIM1 protein C. and mRNA D. were higher in BaP-treated mice lung tissues than those in the control group. The level of STIM1 in BaP-treated mice lung tissues was detected by immunohistochemistry E. Plates e1 (200×) and e2 (400×) represent the lung sections of BaP-treated group, and plates e3 (200×) and e4 (400×) represent the lung sections of the control group. The BaP-treated group exhibited strong cytoplasmic and nuclear STIM1 staining in some cells (e1 and e2). * P < 0.05.
