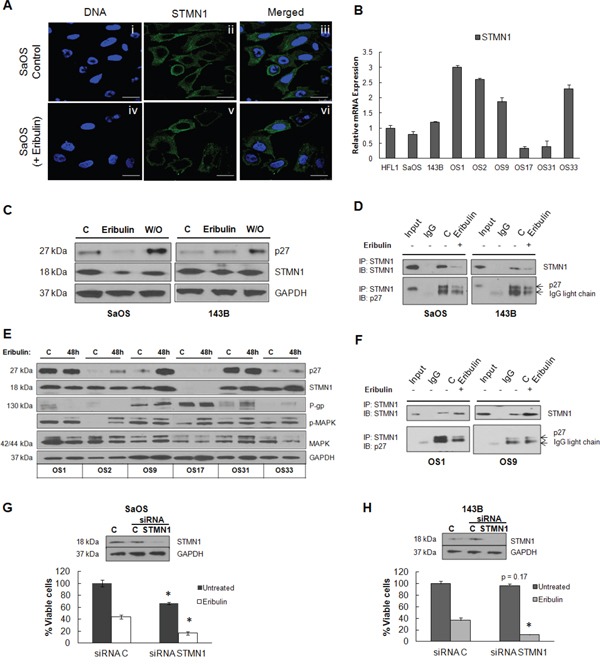
Figure 4. STMN1 expression and association with p27.

A. Confocal immunofluorescence imaging of STMN1 (green) was performed on untreated SaOS (i – iii) and eribulin-treated SaOS (iv – vi) cells exposed to 10 nM eribulin for 24 hours. Panels vii – ix and x - xii show untreated and eribulin-treated 143B cells. Hoechst staining (blue) represent nuclei. Scale bars - 10 μm. B. Quantitative RT-PCR of STMN1 mRNA derived from each osteosarcoma xenograft tumor, shown as –fold change relative to HFL1. C. Immunoblot of lysates of SaOS and 143B cells untreated, treated with eribulin or subjected to drug washout (W/O) was performed using antibodies against p27 and STMN1. GAPDH was loading control. D. Lysates of SaOS and 143B cells either untreated or treated with eribulin were incubated with anti-STMN1 antibody. Immunoblots of immunoprecipitated complexes were probed with antibodies against STMN1 and p27. The extent of coimmunoprecipitation was variable for each protein. E. Untreated control osteosarcoma xenograft tumors and tumors harvested from mice treated with eribulin for 48 hours were lysed and assessed by immunoblot using antibodies against p27, STMN1, P-gp, p-MAPK and MAPK. GAPDH was loading control. F. Lysates of OS1 and OS9 xenograft tumors either untreated or treated with eribulin were incubated with anti-STMN1 antibody. Immunoblots of immunoprecipitated complexes were probed with antibodies against STMN1 and p27. The extent of coimmunoprecipitation is variable for each protein. G. Immunoblot of STMN1 protein following treatment of SaOS and H. 143B cells for 24 hours with siRNA targeting STMN1. STMN1 knockdown (siRNA STMN1) and STMN1 expressing cells (siRNA C) were treated with eribulin and cell viability was measured by cell titer blue assay. The percentage of viable cells for each group is shown relative to cells treated with control siRNA. Data are presented as mean absorbance ±SE of six replicates, n = 6.
