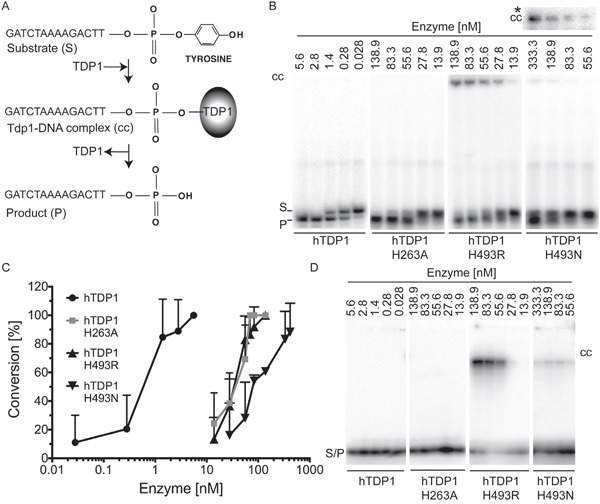
Figure 5. In vitro analysis of catalytic activity of hTDP1 enzymes.

A. Schematic of in vitro TDP1 catalytic activity assay. 5’-32P labeled 14-mer oligonucleotide substrate containing 3’phospho-tyrosine (Substrate (S)) is covalently bound by TDP1 (TDP1-DNA complex (cc)), and subsequently released as 3’phosphoryl end (Product (P)). N-terminally FLAG-tagged hTDP1 protein ranging from 5.6 to 333.3 nM was incubated with 16.7 nM of 5′-32P labeled substrate for 10 minutes at 30°C. Reactions were split into two aliquots. B. One aliquot was resolved on a denaturing 20% polyacrylamide/8M urea gel, to detect the conversion of the 3′phospho-tyrosine (S) to 3′phosphoryl (P). Stable covalent enzyme-DNA complexes (cc) migrated into gel just under the well. cc* To detect hTDP1H493N-DNA cc we increased the exposure time from 1 hour to overnight. C. The average and standard deviation of substrate to product conversion (product/[product +substrate]) from (B) were quantitated by ImageStudio Lite (version 3.1.4, LI-COR) of at least three independent experiments. D. The other aliquot was resolved by 12% SDS-PAGE to detect covalent enzyme-DNA intermediates (cc). Shown are equal exposure times.
