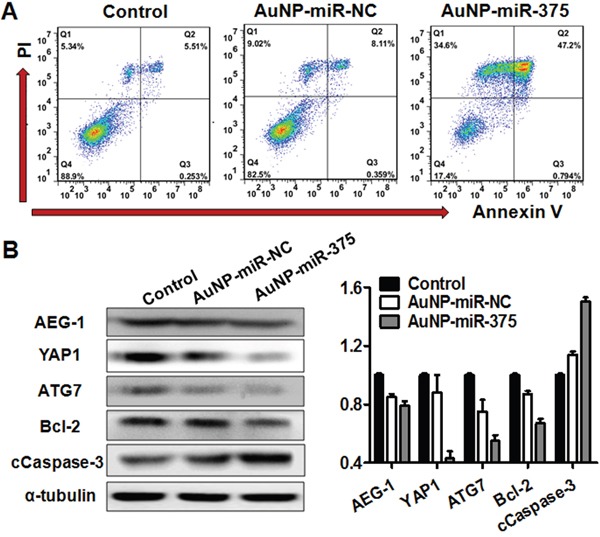
Figure 4. AuNP-miR-375 induced cell apoptosis in Hep3B cells and acted on miR-375′s downstream genes.

A. Apoptosis determined by flow cytometry analysis in Hep3B cells treated with AuNP-miR-375. Hep3B cells were treated with AuNP-miR-NC or AuNP-miR-375 (100 nM miR-375) for 48 h. Quadrants from lower left to upper left (counter clockwise) represent healthy, early apoptotic, late apoptotic, and necrotic cells, respectively. The percentages of cells in each quadrant were shown on the graphs. B. AEG-1, YAP1, ATG7, Bcl-2, and cleaved Caspase 3 proteins were measured by western blot analyses 48h after treatment. α-tubulin was used as a loading control. For quantification of the western blotting bands, pictures were analyzed software Image J (version 2.0) and data are expressed as mean ± SEM of 3 scanning.
