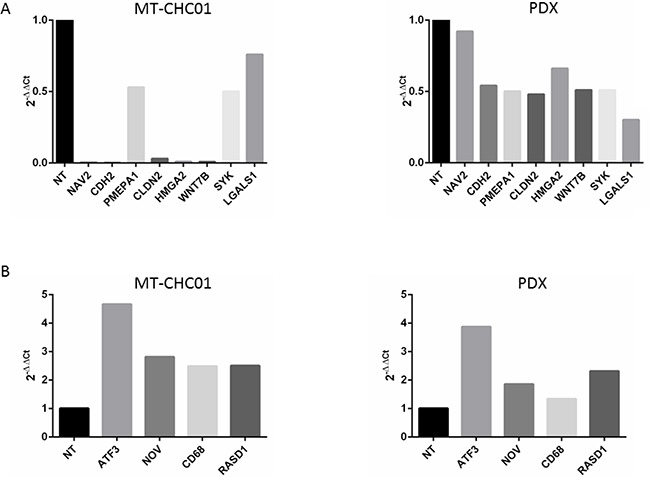
Figure 2. Gene expression validation by qRT-PCR of selected genes altered in microarray analysis.

Panel A shows down-regulated genes and Panel B up-regulated genes after trabectedin treatment. X axis: gene expression of MT-CHC01 and PDX, respectively. Y axis: 2-ΔΔCt for qRT-PCR.
