
Figure 3.
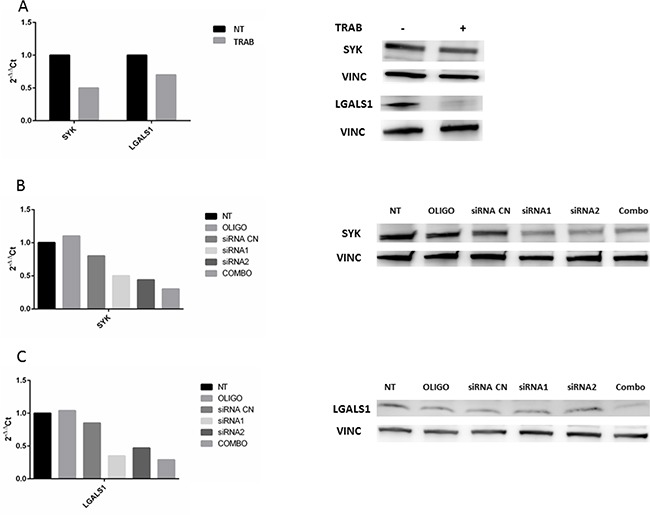
Panel A: qRT-PCR quantification and Western Blot analysis of SYK and LGALS1 after trabectedin (5 nM) treatment on MT-CHC01 cells. Panel B and C: qRT-PCR quantification and Western Blot analysis of SYK and LGALS1, respectively, after silencing. NT: not treated; OLIGO: cells treated with oligofectamine; siRNA CN: cells treated with negative control siRNA; siRNA1 and siRNA2: two different siRNA for SYK or LGALS; COMBO: combination of siRNA1 and siRNA2.