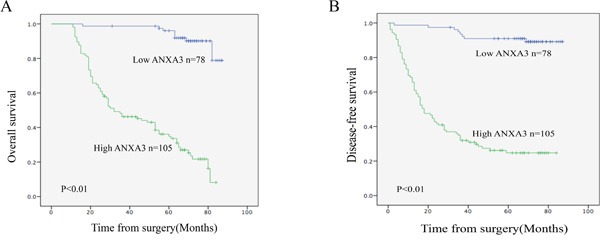
Figure 3. Kaplan-Meier survival curves of gastric cancer patients after gastrectomy.

A. The overall survival of patients in the ANXA3-high group was significantly lower than that of patients in the ANXA3-low group (log-rank test, n=183, P<0.01). B. The Disease-free survival of patients in the ANXA3-high group was significantly lower than that of patients in the ANXA3-low group (log-rank test, n=183, P<0.01).
