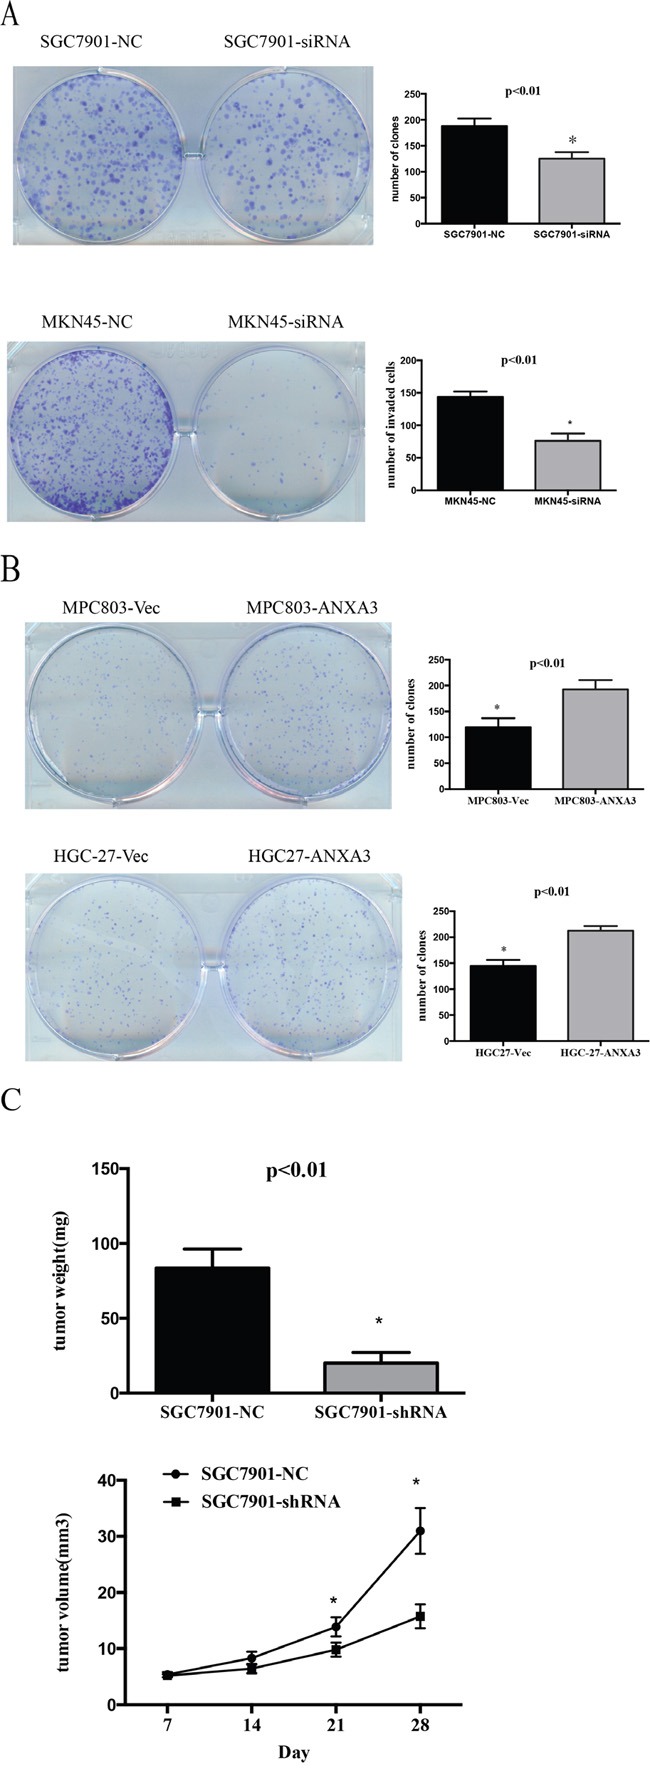
Figure 5.

A-B. Representative images of the increased colony formation ability induced by ANXA3 in gastric cancer cell lines. Quantitative analyses of colony formation numbers are shown in the right panel. C. Representative images of xenografts and a summary of tumor weight in nude mice. The weights of xenograft tumors are summarized in the right panel. All results are expressed as the mean ± SD of three independent experiments. *, P<0.05.
