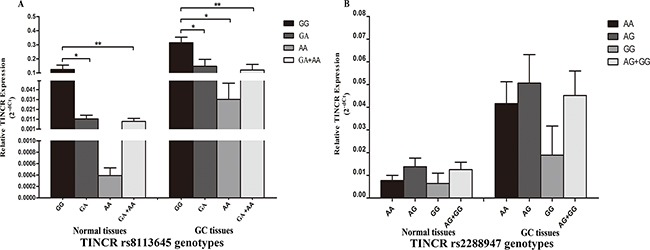
Figure 1. Correlation between rs8113645 and rs2288947 genotypes and expression of TINCR mRNA.

A. Genotype-phenotype correlation for rs8113645 and relative expression levels of TINCR mRNA. Relative TINCR mRNA expression levels were significantly lower for the GA (0.011 ± 0.004) and GA+AA genotypes (0.009 ± 0.003) than the GG genotype (0.124 ± 0.003) in normal tissues (*P < 0.05; **P < 0.01). In gastric cancer tissues, relative TINCR mRNA expression levels were significantly lower for the GA (0.147 ± 0.0049), AA (0.031 ± 0.016) and GA+AA genotypes (0.121 ± 0.039) than the GG genotype (0.314 ± 0.039) (*P < 0.05; **P < 0.01). B. Genotype-phenotype correlation for rs2288947 and relative expression levels of TINCR mRNA. Relative TINCR mRNA expression levels were similar among the three groups with rs2288947 AA, AG and GG genotypes in both normal and gastric cancer tissues.
